RSI Signals Potential Shift In Price Action
USDCAD, often called the “Loonie,” is a widely traded forex pair representing the strength of the US Dollar against the Canadian Dollar. With multiple key US events, including FOMC member speeches and labor data (NFP, Unemployment Rate), and critical Canadian releases such as Employment Change and Unemployment Rate, the USD CAD daily chart technical and fundamental analysis suggests intensified price action. A more hawkish tone from Federal Reserve policymakers or robust US job numbers could push USD higher, while stronger Canadian employment figures may support CAD, creating heightened volatility around significant support and resistance zones on the USD/CAD daily chart.
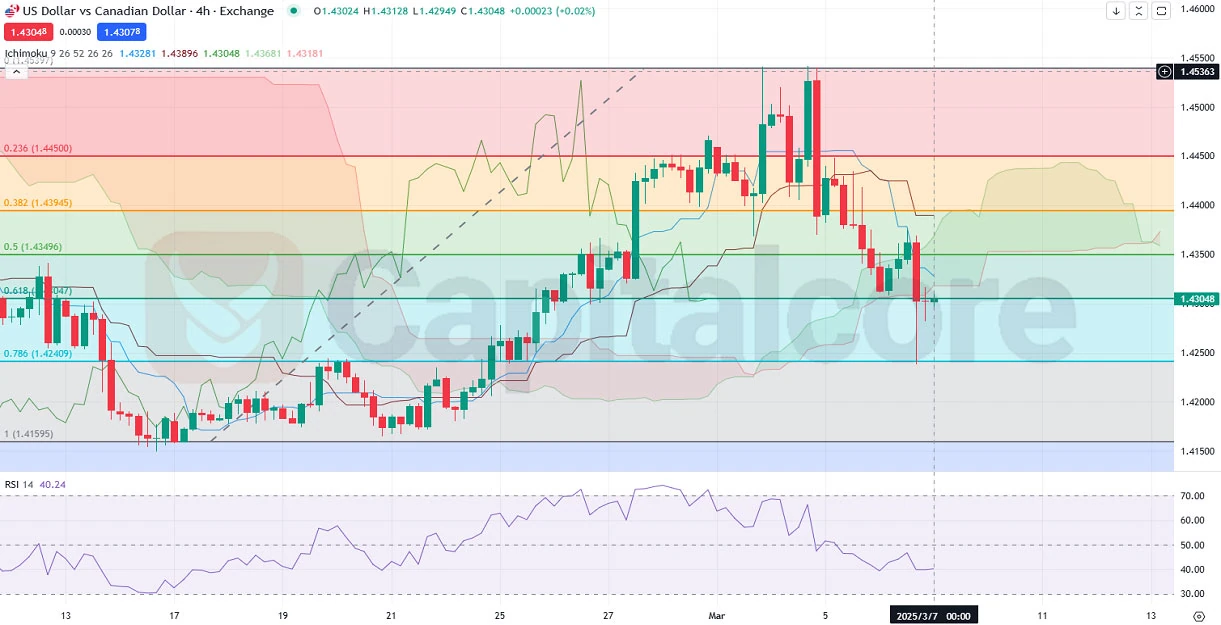
Chart Notes:
• Chart time-zone is UTC (+02:00)
• Candles’ time-frame is 4h.
In the uploaded USDCAD H4 chart, recent price action has trended downward, with candles dipping into the green Ichimoku cloud and breaking briefly below it. However, the 0.618 Fibonacci Retracement Level appears to have provided support, halting a sharper decline. The latest candle is currently green, indicating a potential rebound, yet traders should closely watch the RSI to gauge momentum strength and confirm any shift in price action. A sustained move above the cloud could signal a bullish reversal, whereas a further drop below the 0.618 level might open the door for additional downside pressure.
• DISCLAIMER: Please note that the above analysis is not an investment suggestion by “Capitalcore LLC”. This post has been published only for educational purposes.
