Japan 225 Technical Outlook EMA and RSI Indicators Today
Nikkei 225, commonly referred to as “Nikkei,” is Japan’s premier stock market index, representing 225 major companies listed on the Tokyo Stock Exchange. Widely known by traders as “Japan 225,” it is extensively analyzed for insights into Japan’s economic health. Today’s fundamental analysis is significantly driven by upcoming Japanese economic news, particularly the Labor Cash Earnings, Household Spending, and Composite Index of Leading Indicators. An increase in employment income and consumer expenditures typically supports a bullish sentiment for the Japanese Yen (JPY), indicating robust domestic economic activity. Positive actual figures exceeding forecasts in these metrics would enhance investor confidence, potentially influencing Nikkei positively by boosting domestic corporate earnings outlooks.
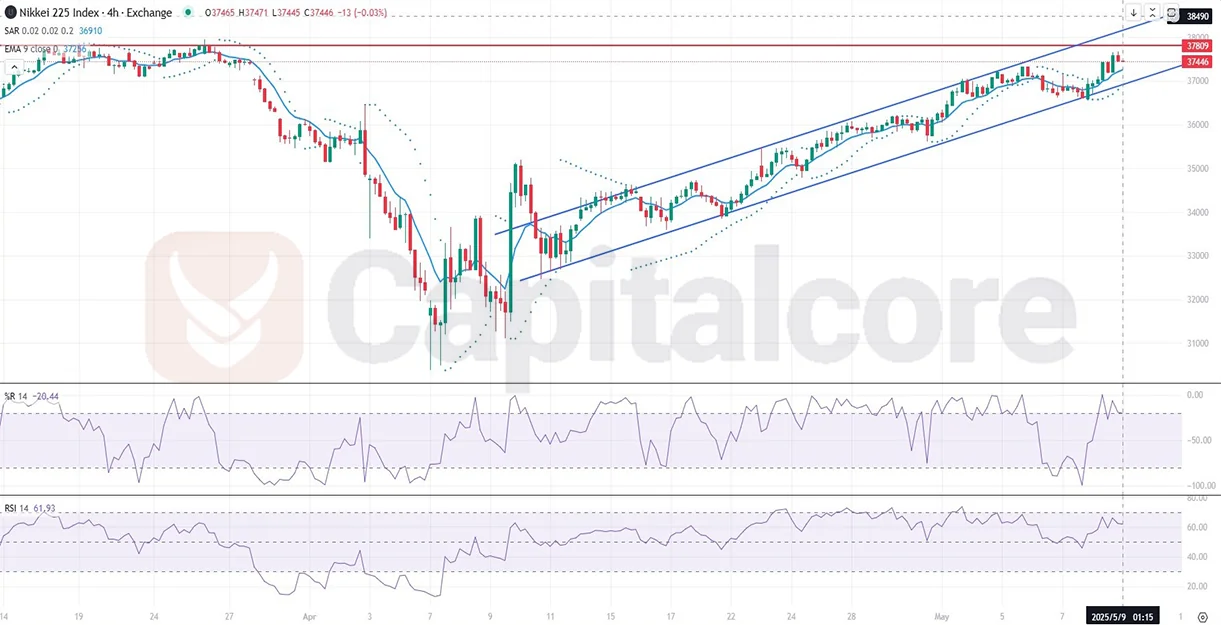
Chart Notes:
• Chart time-zone is UTC (+03:00)
• Candles’ time-frame is 4h.
Analyzing the Nikkei 225 H4 chart, price action demonstrates a clear upward channel. Having recently reacted off the channel’s lower boundary, the price is now advancing towards the resistance level at 37809, which is a critical test zone. Successful penetration of this resistance could propel the index towards the channel’s upper line, continuing the bullish momentum. The EMA 9 indicates ongoing bullish sentiment as the price remains above it. The Parabolic SAR supports a bullish scenario, positioned beneath recent candles. Williams %R, currently around -20.44, and the RSI near 61.93 suggest moderate bullish strength with room for further upward movement before entering overbought territory.
• DISCLAIMER: Please note that the above analysis is not an investment suggestion by “Capitalcore LLC”. This post has been published only for educational purposes.
