Nikkei225 H4 Chart MACD RSI Indicate Continued Bullishness
The JAP-Nikkei225, often referred to simply as the Nikkei, is Japan’s primary stock market index representing the top 225 blue-chip companies listed on the Tokyo Stock Exchange. Traders commonly monitor the Nikkei due to its significant influence on global market sentiment. Today’s fundamental outlook is notably impacted by the latest JPY news. The Manufacturing PMI from S&P Global and the Bank of Japan’s upcoming statements on monetary policy and interest rates are anticipated. A PMI above 50 would signal economic expansion, strengthening the Yen and potentially applying bearish pressure on the Nikkei. Additionally, hawkish tones from the BOJ interest rate statement or economic outlook could further enhance the Yen’s value, creating possible volatility and downward price action in the Nikkei225.
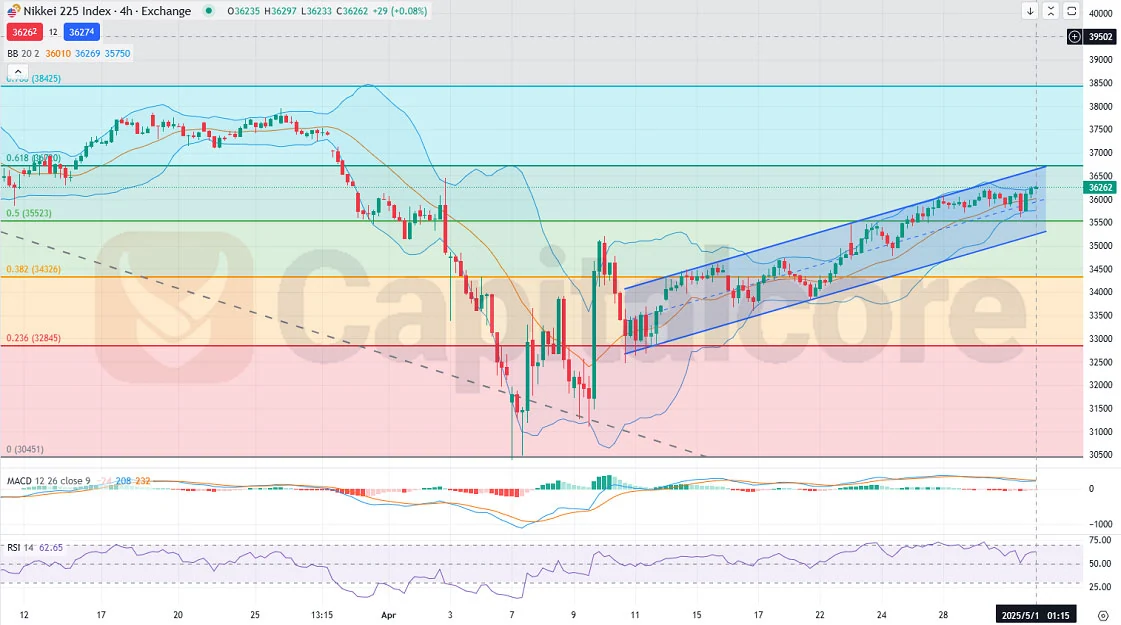
Chart Notes:
• Chart time-zone is UTC (+03:00)
• Candles’ time-frame is 4h.
Analyzing the Nikkei225 H4 technical chart, the Bollinger Bands are currently tightening, indicating a potential upcoming breakout. Price action recently reached the upper Bollinger Band, demonstrating bullish momentum. The index is moving within an ascending channel, indicative of a sustained bullish trend, currently positioned between the 0.5 (35523) and 0.618 (36482) Fibonacci retracement levels and moving closer to testing the crucial 0.618 Fib level resistance. MACD shows a slight bullish divergence as the histogram remains positive, signaling continuing upward momentum, although strength is moderate. RSI, at approximately 62, is also supporting bullish sentiment but approaching the overbought threshold, suggesting caution for possible reversal signals.
• DISCLAIMER: Please note that the above analysis is not an investment suggestion by “Capitalcore LLC”. This post has been published only for educational purposes.
