Market News
AUDUSD Analysis: Understanding the Bearish Trend and Bullish Opportunities
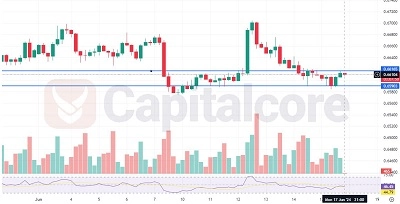
AUDUSD and Key Levels to Watch for a Breakout The AUD/USD currency pair, often referred to by traders as the
AUDUSD and Key Levels to Watch for a Breakout The AUD/USD currency pair, often referred to by traders as the
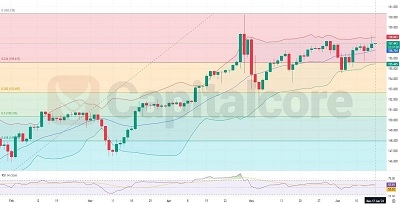
Gopher’s Trends and Economic Indicators in Forex Market Insight The USDJPY forex pair, often referred to by its nickname “Gopher,”
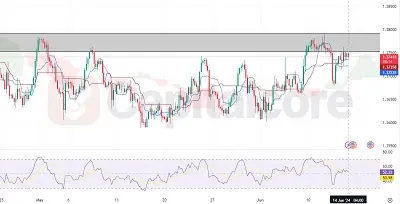
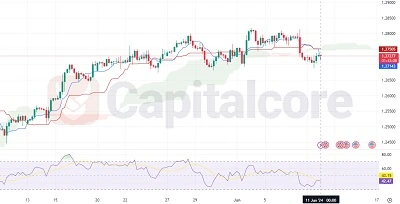
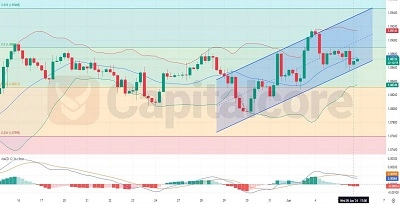
Bullish Momentum on the Rise The USD/CAD pair, often referred to as the “Loonie,” is a popular forex pair that
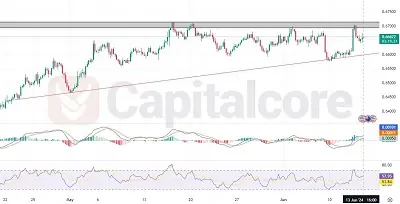
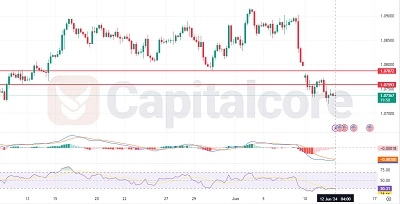
Aussie Dollar Bearish Potential The AUD/USD currency pair, commonly known as the “Aussie,” is currently facing a significant resistance level,
Analyzing the Momentum in EUR/USD EUR/USD, commonly referred to as “Fiber” in the forex trading community, is one of the
The GBP/USD H4 price chart has experienced a significant bearish wave, with the price line descending well below the Ichimoku
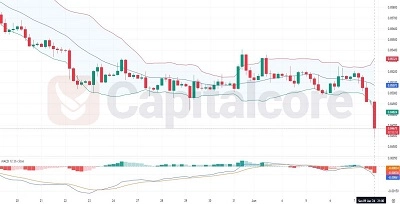
EURGBP Technical Breakdown and Fundamental Impacts The EUR GBP forex pair, commonly referred to as “Chunnel,” represents the exchange rate
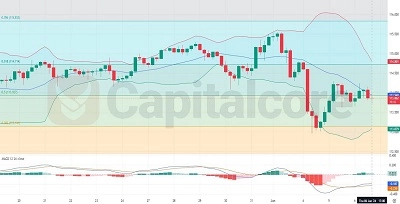
CADJPY H4 Chart Key Insights and Technical Analysis The CADJPY forex pair, representing the Canadian Dollar versus the Japanese Yen,
EUR/USD H4 Price Action and Indicators The EUR/USD forex pair, representing the Euro and the US Dollar, is one of