Market News
GBPCAD Technical Analysis: Bullish Indicators
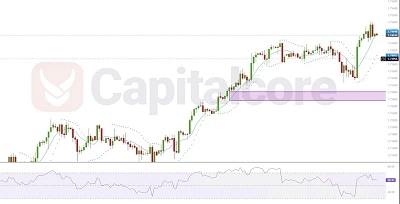
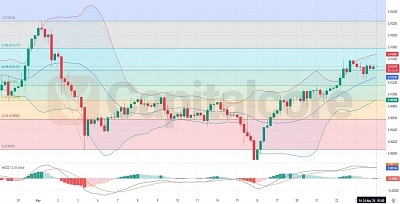
GBPCAD Price Forecast: Analyzing Bullish Trends On the GBPCAD H4 analysis for 6.5.2024, the Parabolic SAR indicator is positioned below
GBPCAD Price Forecast: Analyzing Bullish Trends On the GBPCAD H4 analysis for 6.5.2024, the Parabolic SAR indicator is positioned below
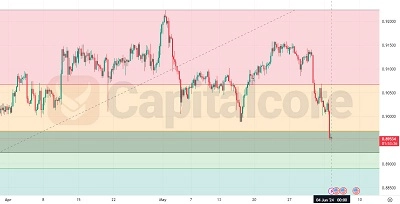
USDCHF: Economic News Impact and Price Trends The USDCHF currency pair, representing the exchange rate between the US Dollar and
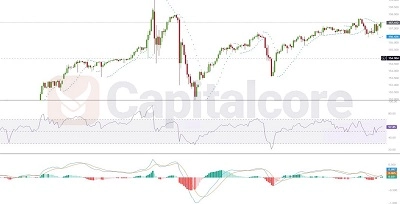
Bullish Signals Dominate USD/JPY Chart Analysis The Parabolic SAR dots positioned below the candles indicate a buy signal, supporting the
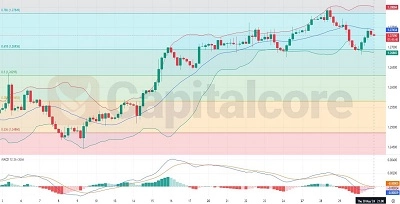
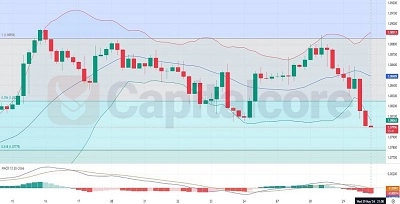
Cable’s Technical Outlook with Bollinger Bands and MACD The GBPUSD currency pair, also known as Cable, represents the exchange rate
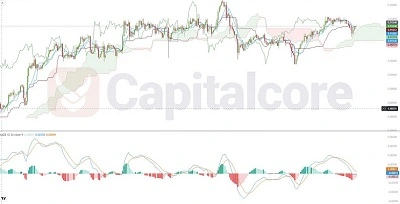
Understanding EURUSD Movements Indicators Data The EURUSD currency pair chart represents the exchange rate between the Euro and the US
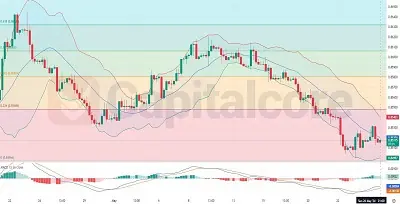
USDCHF Market Outlook Analyzing the USD/CHF chart provided, today’s forecast suggests a potential period of stabilization or minor retracement. The
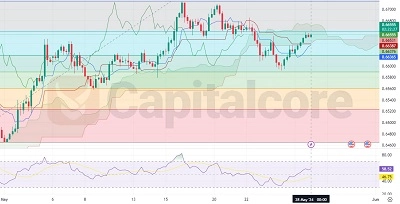
H4 Candlestick Chart Insights The AUD/USD price chart analysis on the H4 candlestick chart indicates that the price line seems
EURGBP Currency Pair Forecast and Technical Overview The EUR/GBP currency pair chart is a vital indicator for analyzing the economic
MACD Shows Bullish Momentum for USDCHF The USD/CHF currency pair, reflecting the exchange rate between the United States Dollar (USD)