Market News
Gold Uptrend Analysis
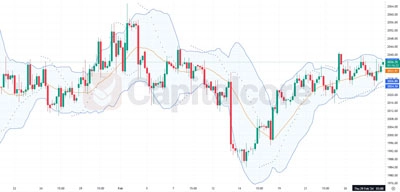
Bullish Gold Trend: Technical Chart Insights The H4 chart for gold shows a recent bullish trend, indicated by the last
Bullish Gold Trend: Technical Chart Insights The H4 chart for gold shows a recent bullish trend, indicated by the last
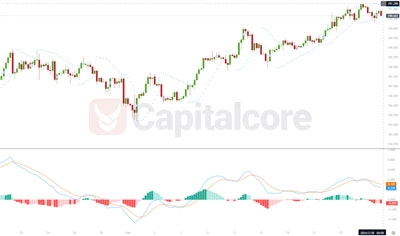
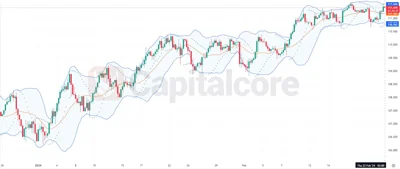
Sustained Uptrend for GBPJPY Revealed by Parabolic SAR, While MACD Hints at Momentum Shift In the provided chart of GBPJPY,
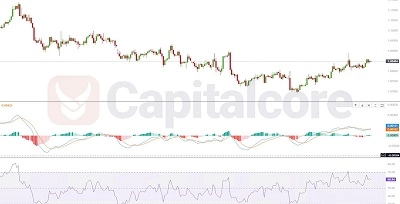
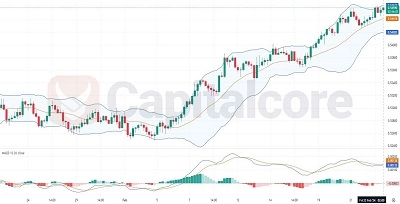
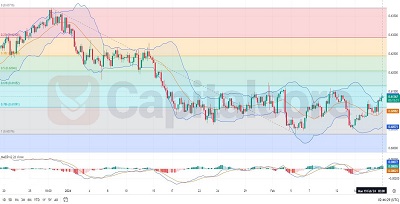
Momentum Shifts in Forex: A Technical Dive into EUR/USD’s Latest Trends The MACD line (blue) is above the signal line
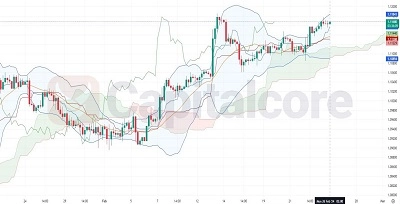
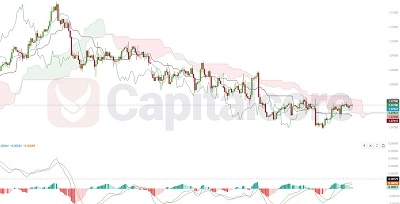
GBP/CHF Clings to Bollinger’s Bullish Bias The GBP/CHF currency pair, a barometer of relative economic performance between the United Kingdom
The Bullish Case for NZD/CHF: Technical Indicators in Accord The NZD/CHF currency pair, representing the exchange rate between the New
CADJPY Uptrend: Bollinger and SAR Insight The H4 chart for CADJPY shows a recent uptrend as indicated by the Parabolic
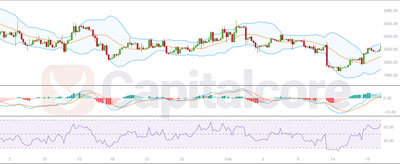
Interpreting Gold’s Movement Analyzing the Gold market on the H4 time frame, as shown in the uploaded chart, we see
Navigating the EUR/USD Pair: Insights from Ichimoku Cloud and MACD Indicators The EUR/USD currency pair depicted in the chart is
NZDUSD: Climbing to New Heights? The NZDUSD pair, a dynamic duo reflecting the interplay of the US and New Zealand