Market News
BTC/USD Ascends with Bullish Vigor
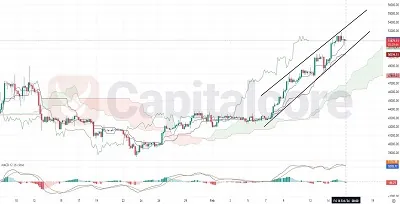
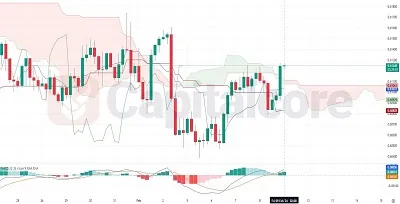
BTC’s Momentum: Ichimoku and MACD Insights Bitcoin has been exhibiting a strong performance as seen in the BTC/USD chart dated
BTC’s Momentum: Ichimoku and MACD Insights Bitcoin has been exhibiting a strong performance as seen in the BTC/USD chart dated
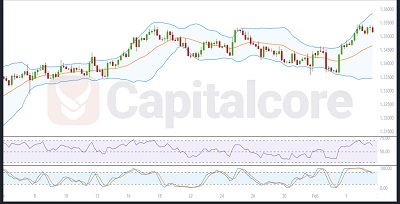
Ethereum’s RSI: Strength in the Bullish Zone Ethereum (ETH) continues to assert its prominence in the cryptocurrency market with its
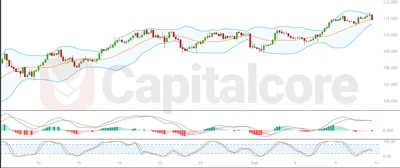
Interpreting CAD/JPY’s Dynamics In the foreign exchange market, examining the CAD/JPY pair on the H4 time frame with a blend

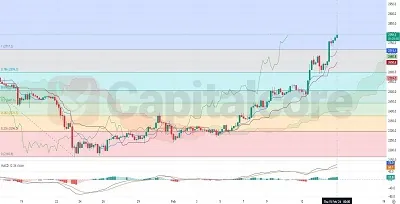
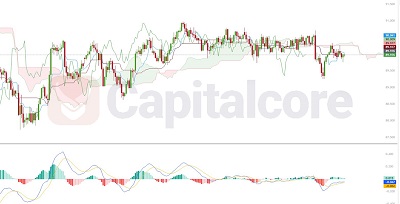
Riding the Momentum: Comprehensive Ichimoku and MACD Technical Analysis for ETH/USD on H4 In the provided ETH/USD 4-hour chart, the
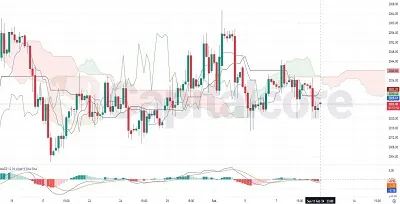
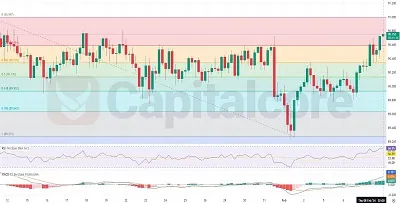
Gold’s H4 Chart: A Technical Tug-of-War Gold’s price dynamics often reflect a multitude of global economic factors, making its technical
Kiwi Climbs Skyward: H4 Ichimoku Insight The NZDUSD currency pair, often referred to as the “Kiwi,” represents the exchange rate
The Kiwi’s Flight Against the Yen: A Technical Analysis The NZDJPY currency pair, representing the exchange rate between the New
Interpreting USD/CAD’s Movement Analyzing the USD/CAD market on the H4 time frame, as presented in the chart, we engage a
NZDJPY Technical Analysis: Navigating Through Market Indecision The NZDJPY chart presents a picture of indecision as the price oscillates within