Market News
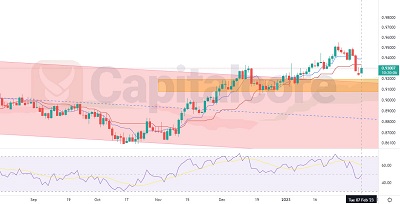
USD/CAD Price Plummets as Bearish Signals Emerge
USD/CAD Exchange Rate Declines as Bearish Sentiment Takes Hold The USD/CAD pair is a popular currency pair, particularly for traders
USD/CAD Exchange Rate Declines as Bearish Sentiment Takes Hold The USD/CAD pair is a popular currency pair, particularly for traders
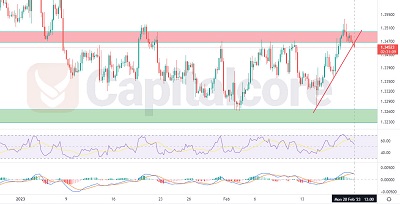
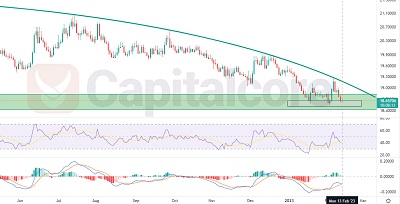
The overall of the chart is strongly bearish Following a very strong ascending wave on AID/NZD price chart, the price
The bullish power seems to be weakening The price line on AUD/NZD price chart ignited a bullish wave on December
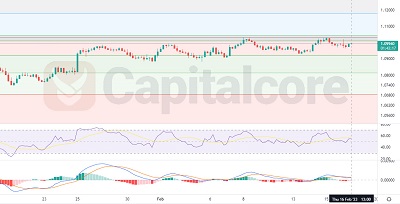
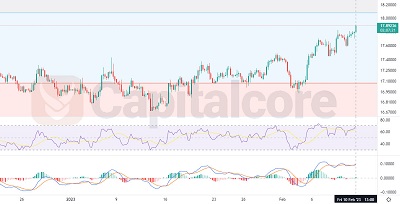
The price line is about to take the next bearish leg The price line on this pair started an ascending
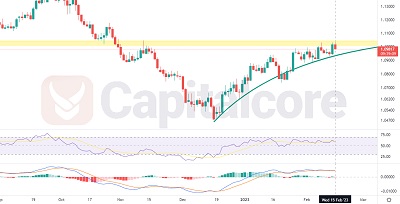
The price line is on a strong resistance zone After a significant long-maintaining bearish wave, the price line on USD/MXN
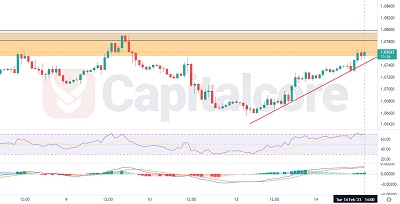
The bearish phase seems to be starting The price line on USD/ZAR started moving bullishly on February the second 2023,
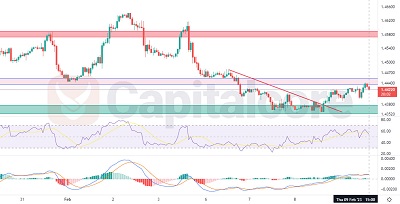
The price line is about to form the next wave After a strong bearish wave, the price line on EURCAD
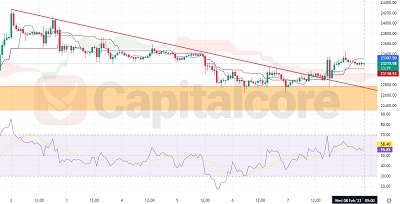
Bullish signals have been issued After a significant bullish phase, the price line on BTC price chart entered a correction
The price line broke above the bearish channel After a long journey within a bearish channel the price line on