Market News
USD/ZAR, about to make a sharp move
A descending triangle is formed on the chart The price line on USD/ZAR price chart started moving bearishly on November
A descending triangle is formed on the chart The price line on USD/ZAR price chart started moving bearishly on November
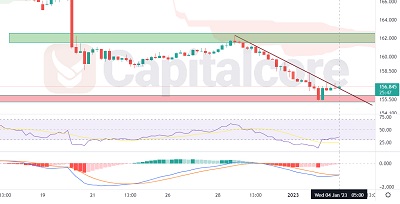
The price line is moving towards the support zone USD/JPY price line started a descending wave on 21st of October
The price line is on a strong resistance After a major loss, GBP/JPY price line started moving sideway, bouncing between
The resistance zoon does not look to be defeating After weeks of bullish market, the price line on Gold price
A strong support zone is backing up the price line After weeks of indecision in the market, GBP/NZD is now
A sharp bullish wave is very potential After several weeks of indecision in the crypto market, the king of crypto
The price line is getting ready for a significant pump After several bounces between the top and the bottom line
The price line broke above the dynamic resistance The bulls were finally able to overcome the dynamic resistance above USD/CHF
The bearish wave looks to be finally ending GBP/JPY has been going through a sharp descending wave since 28th of