Market News
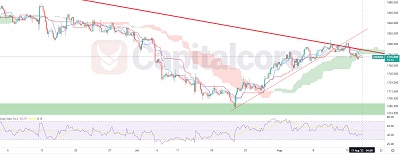
Gold price, starting a bearish wave
The resistance level is still valid Gold price, after going through a strong ascending wave on 21st of July 2022
The resistance level is still valid Gold price, after going through a strong ascending wave on 21st of July 2022
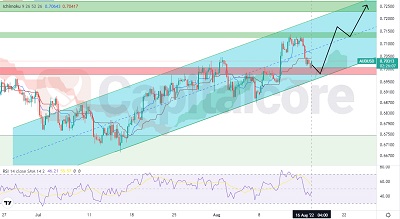
The next ascending leg looks close AUD/USD price has been moving within a bullish channel since 8th of July 2022.
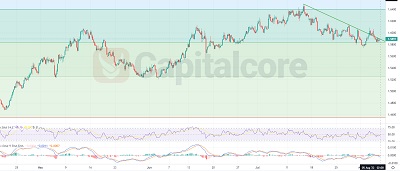
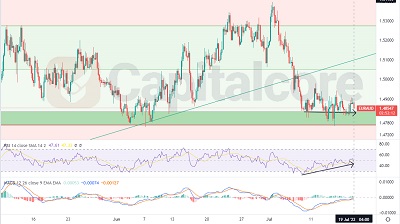
The price line is on an important support level On NZD/USD price chart, the price line is currently on 1.5897;
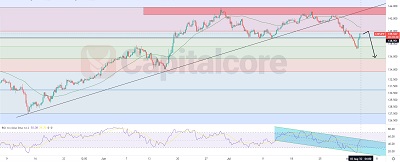
The next descending wave looks close After the release of Customer Confidence Rate, on 02 Aug ‘2022 the price line
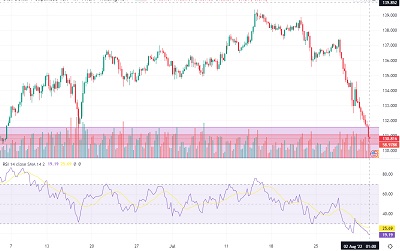
Bulls should keep an eye on the chart USD/JPY started a sharp descending rally on 15th of July 2022, which
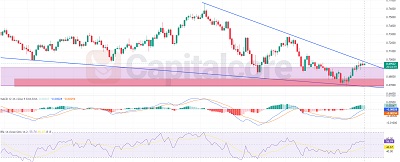
A bullish wave looks to be coming On AUD/USD price chart, the price line formed a descending triangle after going
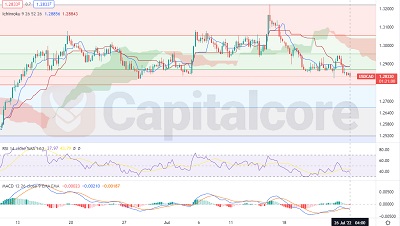
Trend reversal looks potential After a sharp descending rally on USD/CAD, the bearish slope of the price line started to
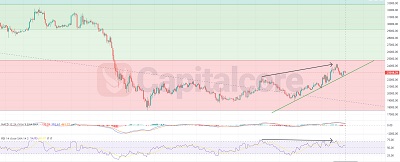
Bearish signals on BTC price chart BTC price chart started a sideway range after the price on this asset had
The price line is on a strong demand level The price line on EUR/AUD price chart, started a descending rally