Market News
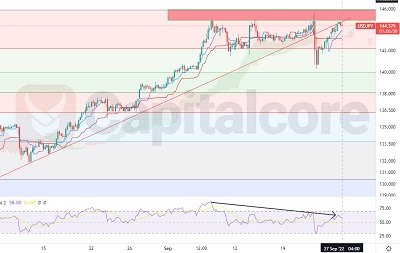
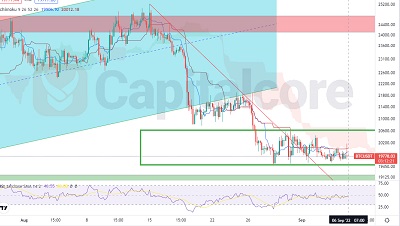
A bearish leg looks potential on USD/JPY
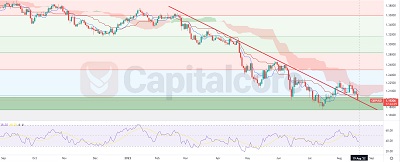
USD/JPY Broke below the trend line The price line on USD/JPY started an ascending trend on August 2nd, 2022; within
USD/JPY Broke below the trend line The price line on USD/JPY started an ascending trend on August 2nd, 2022; within
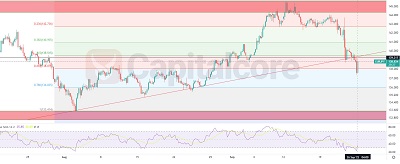
The price line broke below the trend line The price line started an ascending trend on August 2nd, 2022; within
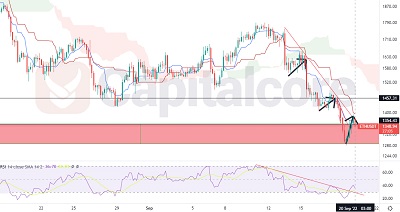
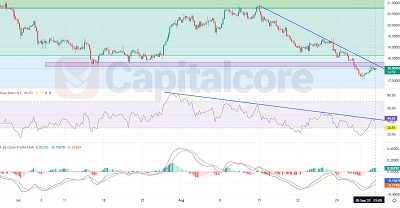
The price line is approaching to a support zone ETH price line has been going through a bearish wave since
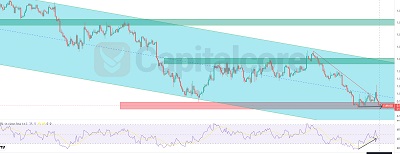
A trend reversal looks potential As a result of a significant descending wave, which started forming on 12th of Aug,
The price on a narrow range of motion Miner Reserve chart, is going through a strong descending wave, which reflects
The price line is on a strong resistance level Silver price started a bearish trend on 18th of April 2022;
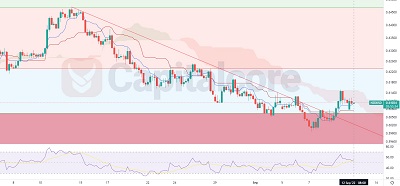
The price line is on a strong support zone The price line on EUR/USD price chart has been moving within
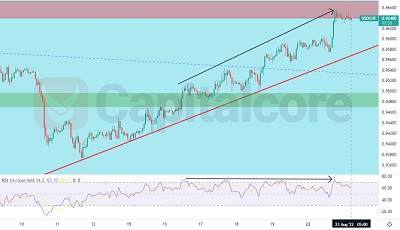
Bearish signals are visible on the chart USD/CHF price, started a strong bullish trend on August 11th, 17:00. The price
A trend reversal is potential GBP/USD started a descending trend on 23rd of February 2022, which caused the price on