Nikkei 225 Fundamental Outlook Before Key US Data
Often referred to as “Nikkei” or the Nikkei Stock Average, the Nikkei 225 Index is Japan’s leading stock market index, tracking the performance of 225 top-tier companies listed on the Tokyo Stock Exchange. This index is traded globally and commonly paired against currencies like the USD or JPY in the forex market. As of today, investors are closely monitoring the X/Y daily chart in anticipation of high-impact economic events from both the United States and Japan.
From a fundamental perspective, today’s session is packed with significant data releases from the U.S., including the TIC Long-Term Purchases, which measure net foreign demand for U.S. securities—a strong reading here could signal increased confidence in the U.S. economy and strengthen the USD. Additionally, Fed’s John Williams is scheduled to speak, potentially providing clues about future interest rate paths. Coupled with the UoM Consumer Sentiment and Inflation Expectations, any hawkish tone could push the USD higher. On the JPY side, Japan’s Core CPI and the Bank of Japan’s latest monetary policy outlook will also be in focus. Traders should be cautious, as unexpected changes from the BOJ Governor’s speech or the Interest Rate Statement may create volatility in the Nikkei/USD or Nikkei/JPY pairs. Given this fundamental landscape, the Nikkei 225 Index is poised for potentially sharp moves depending on data surprises from both economies.
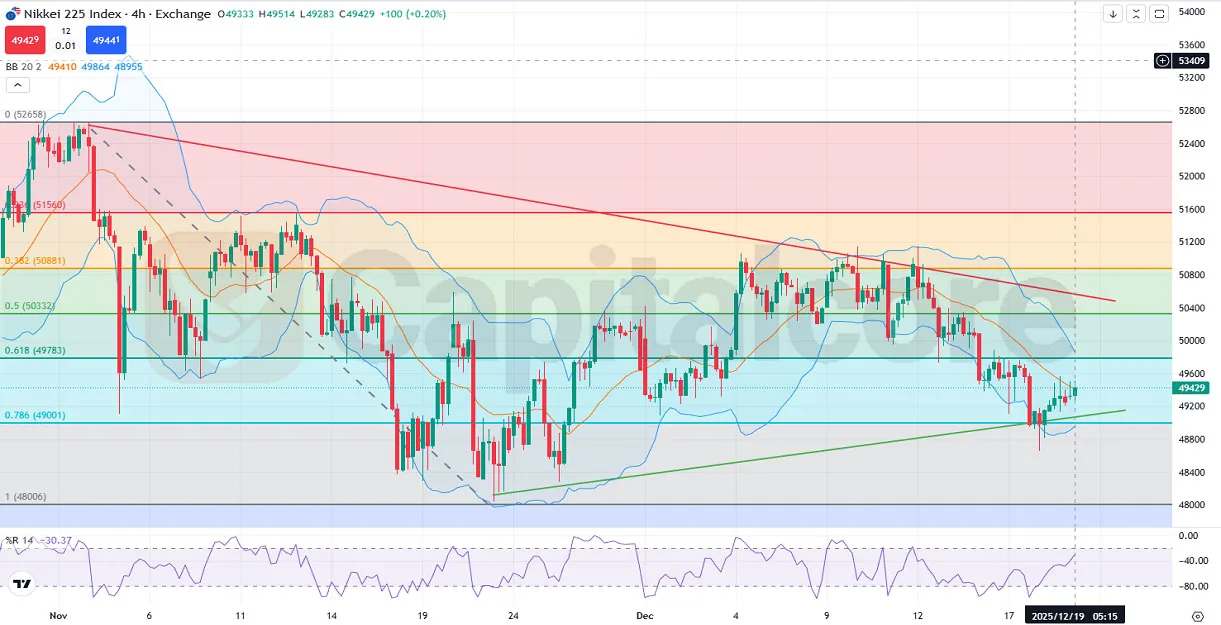
Chart Notes:
• Chart time-zone is UTC (+02:00)
• Candles’ time-frame is 4h.
On the H4 chart, the price action is currently moving in the lower half of the Bollinger Bands, having bounced from the lower band and now heading toward the middle band. This signals a possible short-term bullish correction. Notably, the 0.786 Fibonacci retracement level (49001) aligns closely with the lower Bollinger Band and a rising support trendline, creating a strong confluence zone. This level has recently acted as a springboard, leading to a higher low formation. Despite the bounce, the market has consistently posted lower highs, suggesting a contracting triangle or symmetrical consolidation. The %R14 indicator, currently at -30.37, is near the overbought threshold but still indicates potential for continued upward movement in the short term. A break above the middle Bollinger Band and the descending trendline around 50332 (0.5 Fibonacci) would open the door for a test of 50881 (0.382 level). However, failure to clear these resistances could see the index retesting the 49000–48800 support zone.
•DISCLAIMER: Please note that the above analysis is not an investment suggestion by “Capitalcore LLC”. This post has been published only for educational purposes.


