UK100 Chart Signals Bullish Recovery
UK100, also known as the FTSE 100 or the Footsie, tracks the top 100 companies listed on the London Stock Exchange and is strongly linked to UK equity sentiment, GBP movements, global risk appetite, and USD driven market flows. For today’s UK100 FTSE100 fundamental analysis, traders are watching GBP news including Nationwide House Prices, UK Manufacturing PMI, BOE money supply, mortgage approvals, consumer credit, and BOE Chief Economist Huw Pill’s speech, while USD volatility may come from S&P Global Manufacturing PMI, ISM Manufacturing PMI, ISM Prices Paid, and vehicle sales data. Stronger UK housing, credit, PMI, or hawkish BOE commentary could support GBP sentiment and help FTSE 100 price action if investors see resilient UK growth, but stronger US PMI or inflation signals from ISM Prices Paid may lift the USD and global yields, potentially pressuring equity indices and keeping UK100 FTSE100 daily chart technical and fundamental analysis sensitive to risk sentiment.
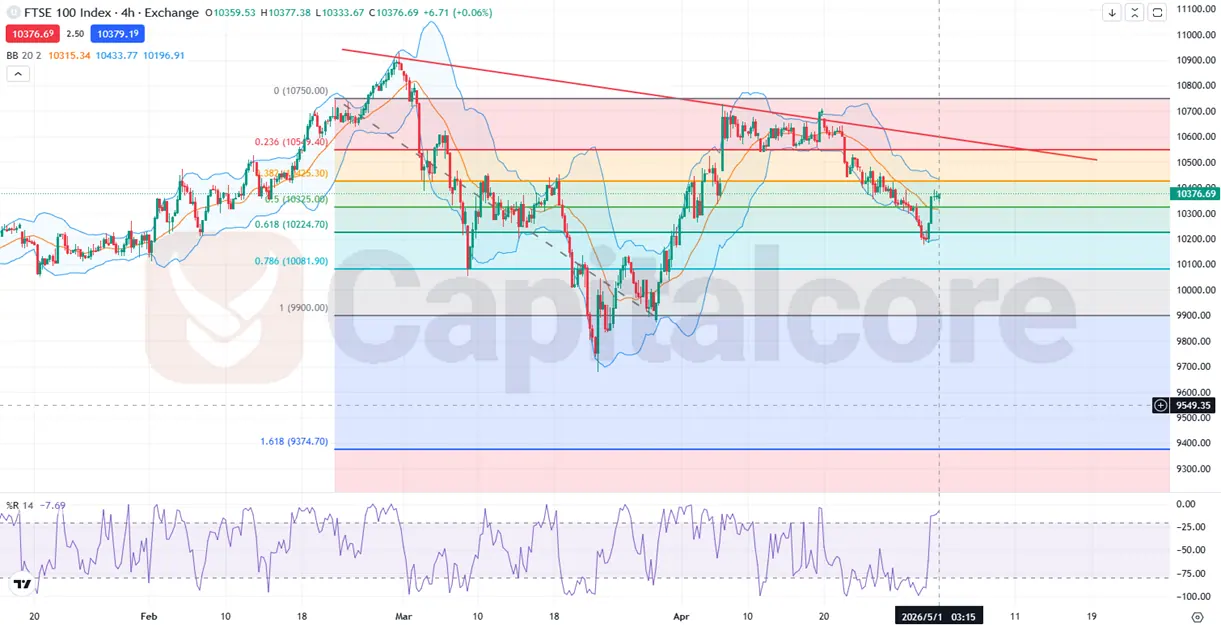
Chart Notes:
• Chart time-zone is UTC (+03:00)
• Candles’ time-frame is 4h
On the UK100 FTSE100 H4 chart, price is showing a sharp bullish rebound from the 10225 to 10200 support zone after rejecting the lower Bollinger Band, confirming short term buyer control and a recovery phase in the current FTSE 100 price action. Price has reclaimed the 0.50 Fibonacci level around 10325, which now acts as the first key support, while deeper downside supports remain at 10224, 10082, and 9900 if the rebound fails. Immediate resistance is located at 10425 to 10435, where the 0.382 Fibonacci retracement and Bollinger Band pressure align, followed by stronger resistance at 10549 to 10570 and then 10630 to 10670 near the descending red trendline. Williams Percent R near -7.70 shows strong bullish momentum but also warns that UK100 is close to overbought conditions, so a pullback or consolidation is possible before continuation. A confirmed H4 close above 10435 would support a bullish FTSE 100 technical analysis outlook toward 10550, while rejection from that zone could send price back toward 10325 and 10225, meaning the short term bias remains bullish recovery but the broader trend only turns convincingly bullish after a breakout and hold above the descending trendline.
•DISCLAIMER: Please note that the above analysis is not an investment suggestion by “Capitalcore LLC”. This post has been published only for educational purposes.


