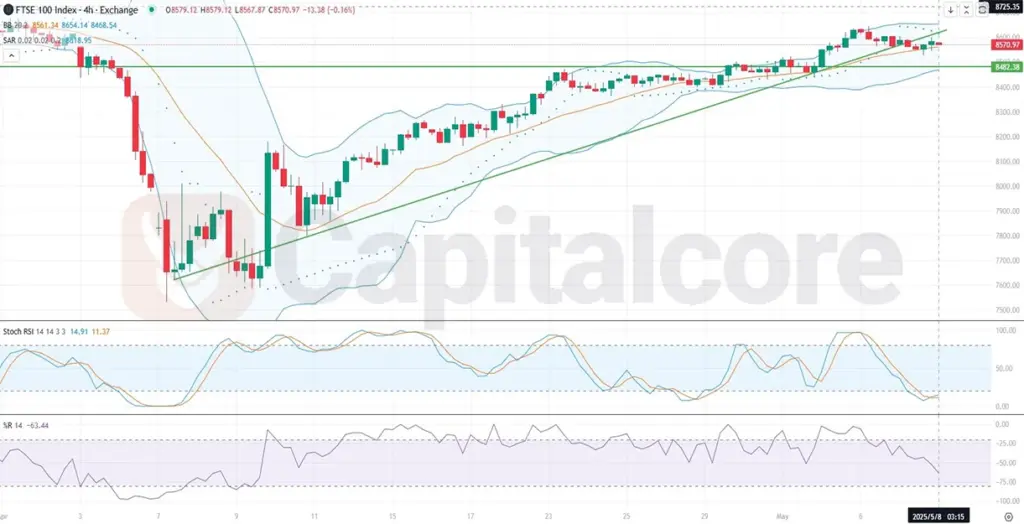
FTSE 100 Forecast and Trend Analysis
The UK100, commonly referred to as the FTSE 100, is a prominent financial instrument tracking the top 100 companies listed on the London Stock Exchange, reflecting economic health in the UK market. Known colloquially as “Footsie,” the UK100 often reacts strongly to economic indicators and monetary policy decisions. Today’s fundamental analysis highlights significant upcoming news including the RICS House Price Balance, HBOS HPI, and reports from the Bank of England. Positive outcomes from these reports, such as higher than forecast house price indexes and hawkish tones in monetary policy summaries and MPC minutes, could strengthen the GBP, reflecting positively on the UK100 by boosting investor confidence and attracting capital flows into UK equities. Investors should closely monitor these economic indicators for cues on future price movements and market sentiment.
Chart Notes:
• Chart time-zone is UTC (+03:00)
• Candles’ time-frame is 4h.
Analyzing the UK100 H4 chart provided, the price is clearly exhibiting an upward trend, currently being supported by the middle Bollinger Band, suggesting potential continuation of the bullish momentum. The price action might soon retest and surpass the established upward trendline again. Additionally, the Stoch-RSI oscillator is showing a divergence, signaling potential weakening of the current bullish momentum and cautioning about possible corrective movements ahead. Bollinger Bands appear to be narrowing slightly, indicating a possible period of lower volatility or consolidation soon. The Parabolic SAR remains below the current candlesticks, supporting the ongoing bullish sentiment. Furthermore, %R is moderately placed, indicating there’s still some buying potential left, though cautious optimism is advised given the divergence seen in Stoch-RSI. Traders should watch closely for the price action around the current support levels for confirmation of continued bullishness or signs of reversal.
• DISCLAIMER: Please note that the above analysis is not an investment suggestion by “Capitalcore LLC”. This post has been published only for educational purposes.


