FTSE 100 Price Action at Crucial Resistance Level
The UK100, commonly known as the FTSE 100 or “Footsie,” tracks the performance of the 100 largest companies listed on the London Stock Exchange and is influenced significantly by the GBP currency movements. Fundamental analysis today highlights crucial releases such as the British Retail Consortium’s Like-for-like Retail Sales and employment indicators, including Average Earnings, Claimant Count Change, and the Unemployment Rate. Positive retail and employment data generally support the GBP, bolstering investor sentiment toward UK equities, including the UK100, as robust labor markets and retail activity indicate consumer spending health, indirectly benefiting companies listed on the FTSE 100.
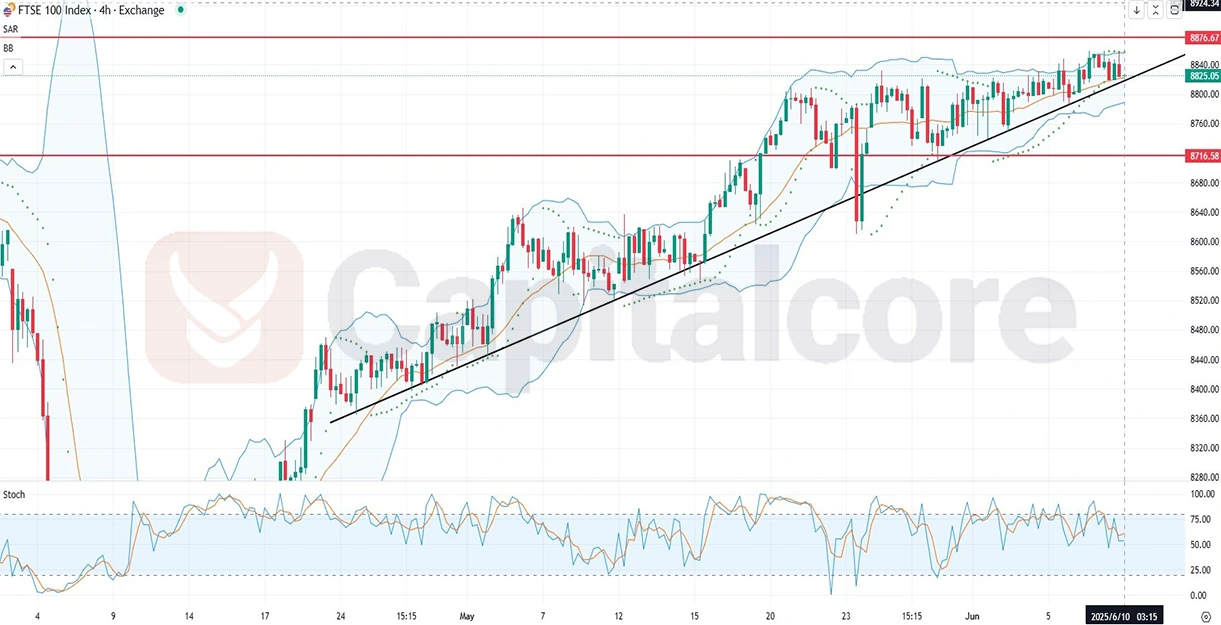 Chart Notes:
• Chart time-zone is UTC (+03:00)
• Candles’ time-frame is 4h.
Analyzing the provided UK100 H4 chart, price action indicates an impending test of the resistance line following a clear trendline support. However, price typically struggles to breach resistance on its initial attempt, suggesting potential multiple retests before successfully breaking through, especially considering the current market momentum. The Parabolic SAR shows bullish momentum, reinforcing the upward trend, while Bollinger Bands indicate moderate volatility with potential consolidation near resistance. The Stochastic indicator suggests a neutral stance, indicating neither strong bullish nor bearish momentum immediately, suggesting cautious optimism as traders await confirmation of breakout direction.
•DISCLAIMER: Please note that the above analysis is not an investment suggestion by “Capitalcore LLC”. This post has been published only for educational purposes.


