Dow Jones consolidates before fundamental catalyst
The US30, also known as the Dow Jones Industrial Average (DJIA), is a benchmark index that tracks 30 of the largest publicly-owned companies listed on stock exchanges in the United States. Often referred to as the “Dow,” this index reflects investor sentiment regarding the strength of the U.S. economy and is a key focus for both forex and equity traders when evaluating risk appetite and macroeconomic trends. From a fundamental analysis perspective, today’s key U.S. economic indicators center around the release of Durable Goods Orders and Core Durable Goods Orders from the Census Bureau. These metrics are critical leading indicators of industrial activity and overall economic momentum. A higher-than-forecasted figure in either data point would signal increased consumer and business confidence, which may strengthen the USD and potentially apply downward pressure on the US30 due to rising interest rate expectations. Conversely, weaker results could bolster the index in the short term, as they might reduce rate hike fears. With traders closely watching these numbers, today’s release could inject volatility into the Dow, especially as the market anticipates any shifts in Federal Reserve policy trajectory based on incoming data.
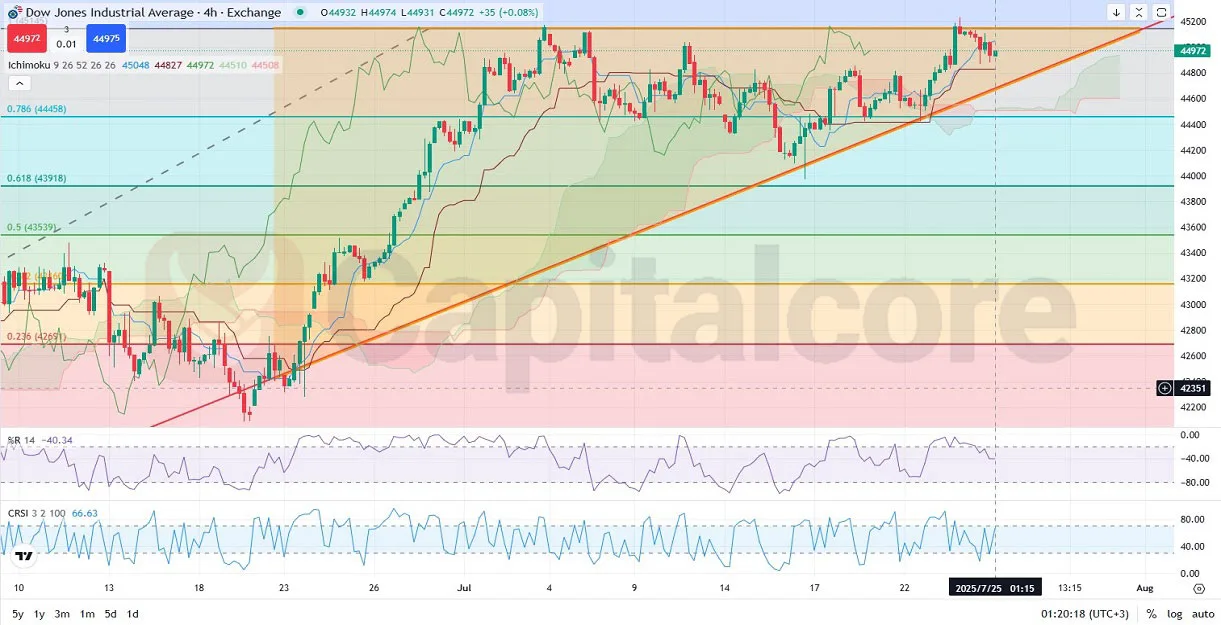
Chart Notes:
• Chart time-zone is UTC (+03:00)
• Candles’ time-frame is 4h.
The US30 Dow Jones 4-hour chart shows a strong long-term bullish trend, supported by a clearly respected ascending trendline (red), which has acted as a dynamic support level on three separate occasions. The price has formed a flat-top orange triangle, repeatedly testing the 1.000 Fibonacci retracement level around 45145, while making higher lows, reflecting buying pressure. Recently, the price was rejected at this key resistance level and has since started to descend toward the 0.786 Fibonacci level near 44458, while still trading above the Ichimoku cloud, which remains bullishly wide, although the lower boundary is flat and horizontal, indicating potential consolidation or slowdown. Momentum indicators show early signs of weakness, with the Williams %R at -40.34 (approaching neutral/bearish territory) and CRSI at 66.63, suggesting a possible short-term pullback or continuation of the consolidation. If the price holds above the trendline and Ichimoku support, a breakout above the 1.000 Fibonacci could trigger the next bullish leg, while a break below the ascending trendline would invalidate the triangle and expose the 0.618 level at 43918.
•DISCLAIMER: Please note that the above analysis is not an investment suggestion by “Capitalcore LLC”. This post has been published only for educational purposes.


