US500 Index Forms Bullish Triangle Pattern
The US500, commonly known as the S&P 500 index, is a prominent stock market index tracking the performance of 500 of the largest publicly traded companies in the U.S. Known colloquially as “The Market,” this index provides investors with insights into the overall health of the U.S. economy. Fundamental analysis for today highlights key economic indicators like GDP, initial jobless claims, and pending home sales. Given the expectations for robust GDP growth, stable jobless claims numbers, and resilient home sales data, bullish sentiment could be further strengthened, potentially supporting upward price action for the US500.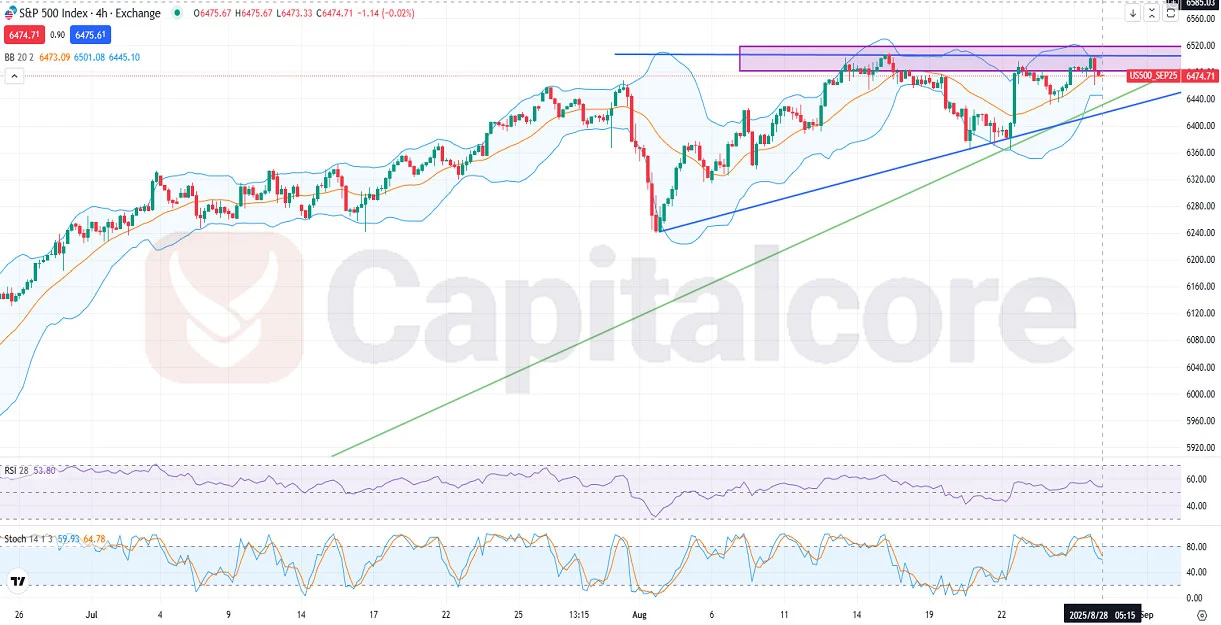 Chart Notes:
• Chart time-zone is UTC (+03:00)
• Candles’ time-frame is 4h.
Technical analysis of the US500 H4 chart indicates a sustained bullish trajectory with recent price action confronting a significant resistance zone. Candles have touched this area multiple times without breaking through convincingly, suggesting strong resistance. A bullish continuation appears likely, supported by the formation of a recent ascending triangle pattern. The Bollinger Bands are currently narrowing, hinting at a possible volatility expansion in the near future. Meanwhile, the RSI stands neutral at 53%, suggesting moderate bullish momentum. The Stochastic oscillator, with the K% at 59.78 and the D% at 64.85, indicates potential bullish continuation but also signals a short-term slowdown or consolidation phase.
•DISCLAIMER: Please note that the above analysis is not an investment suggestion by “Capitalcore LLC”. This post has been published only for educational purposes.


