H4 US500 Chart Market Outlook
US500, often nicknamed the S&P 500, SPX500, or simply the US benchmark index, tracks the performance of leading large cap US companies and is quoted in US dollars, making it highly sensitive to USD strength, Federal Reserve policy, Treasury yields, and US risk sentiment. For today’s US500 fundamental analysis, traders are likely to focus on Fed Governor Christopher Waller’s panel remarks for fresh FOMC monetary policy clues, while ADP NER Pulse employment data and Pending Home Sales may influence expectations for US growth, consumer spending, and interest rate direction. Stronger labor or housing figures could support the USD and higher yields, potentially pressuring US500 price action, while softer data may revive rate cut expectations and support equities; meanwhile, API oil data and the latest Iran headlines add geopolitical risk, as Trump’s decision to delay a planned Iran strike may calm risk aversion, though warnings that Iran’s offer is insufficient keep volatility risks elevated for the US500 H4 and daily chart outlook.
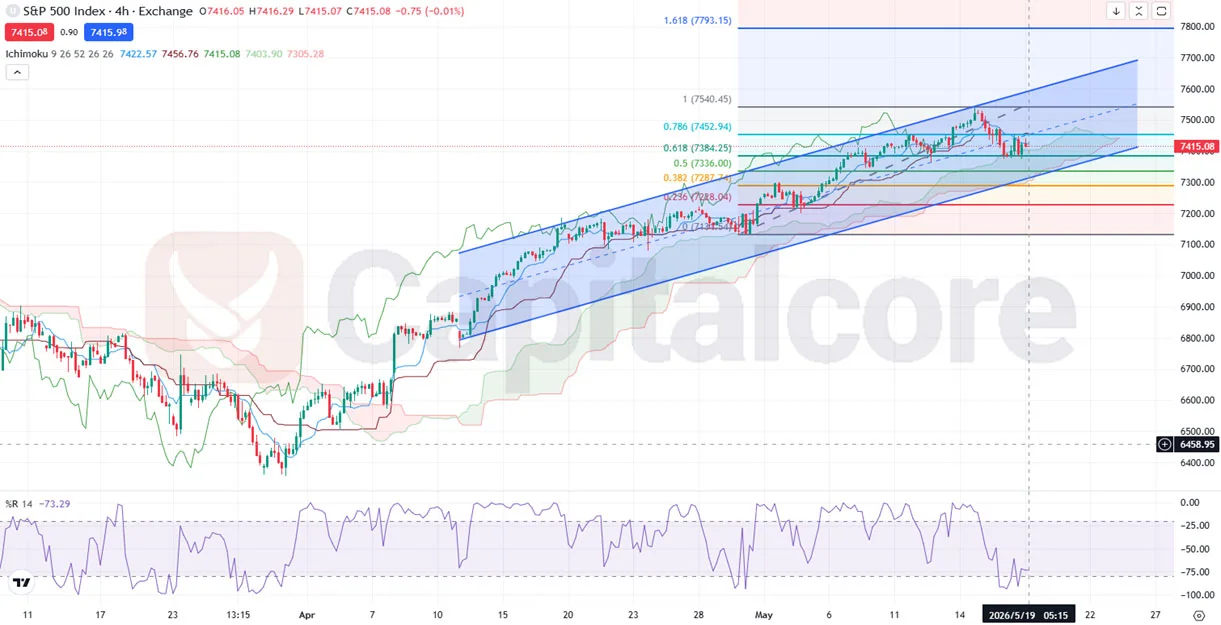
Chart Notes:
• Chart time-zone is UTC (+03:00)
• Candles’ time-frame is 4h
From the uploaded US500 H4 chart, price remains inside a broader bullish ascending channel, but short term momentum has clearly weakened after rejection near the 7453 to 7540 resistance and Fibonacci extension area. Current price around 7415 is holding just above the Ichimoku cloud support near 7404, while trading below the Tenkan sen around 7423 and Kijun sen around 7457, which signals consolidation rather than strong bullish control. The main US500 H4 support zone is 7404 to 7384, followed by 7336, and as long as price holds above this area, the bullish channel structure remains valid with rebound potential toward 7453 and 7540. Williams Percent Range near minus 73 suggests the index is close to oversold territory, which supports a possible recovery if buyers defend cloud support, but a confirmed break below 7336 would weaken the US500 technical analysis outlook and open the door for a deeper correction toward 7287. A clean H4 close above 7457 would restore bullish momentum and improve the US500 price action outlook for another attempt at the upper channel and resistance zone.
•DISCLAIMER: Please note that the above analysis is not an investment suggestion by “Capitalcore LLC”. This post has been published only for educational purposes.


