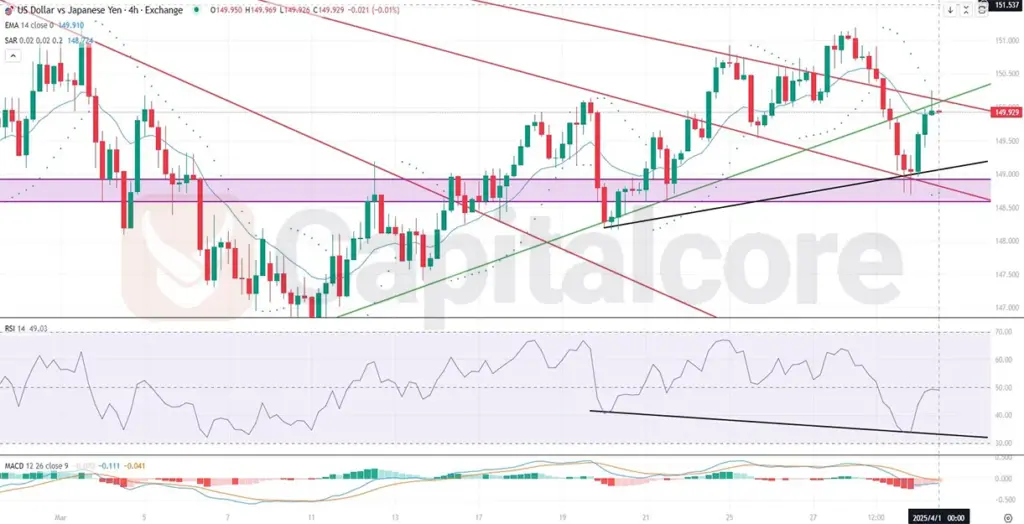
Uptrend Resumption Possible in USD-JPY H4 Chart
The USDJPY forex pair, often referred to as the “Gopher” in trading circles, is a major currency pair representing the US dollar (USD) versus the Japanese yen (JPY). Known for its high liquidity and sensitivity to monetary policy and geopolitical developments, this pair offers rich opportunities for both technical and fundamental traders. Fundamentally, the USD-JPY is in focus today as markets await key comments from Federal Reserve Bank of Richmond President Thomas Barkin, which could shed light on future US interest rate moves. His tone—whether hawkish or dovish—may significantly impact the dollar. On the Japanese side, economic data like the Jobless Rate and the Tankan survey suggest subdued employment concerns but mixed industrial sentiment. While Japan’s Tankan index indicates potential stagnation in manufacturing and services, upcoming US data such as ISM Manufacturing PMI, Construction Spending, and Consumer Confidence are expected to underscore a resilient US economy. Overall, expectations of stronger US macro data and possible hawkish Fed rhetoric give the greenback a fundamental edge in today’s USD JPY outlook, favoring a bullish bias unless data disappoints sharply.
Chart Notes:
• Chart time-zone is UTC (+03:00)
• Candles’ time-frame is 4h.
Technically, the USD/JPY 4-hour chart shows a complex battle between bullish and bearish forces. The pair is gradually breaking downtrend lines one by one, and only one major descending trendline remains to be cleared for a full bullish breakout confirmation. Although the price recently dipped below a key support zone and pulled back—suggesting a potential bearish continuation—the bounce strongly hints at a BOF (Breakout Failure), which aligns with the emergence of a possible bullish trend. This idea is supported by bullish divergence on the RSI, where price made lower lows while RSI printed higher lows, indicating waning bearish momentum. RSI is hovering near 50, signaling neutrality with potential for upward momentum. The MACD histogram is shrinking its bearish bars, and lines are close to a bullish crossover, reinforcing the upward scenario. Meanwhile, the Parabolic SAR still prints above the candles, indicating short-term bearish bias, but this can flip quickly if momentum continues. Watch for a breakout above the final trendline for confirmation of a sustained uptrend continuation in the USDJPY daily chart technical analysis.
• DISCLAIMER: Please note that the above analysis is not an investment suggestion by “Capitalcore LLC”. This post has been published only for educational purposes.


