USD-CAD Analysis MACD and CRSI Signals Update
The USD CAD, popularly known as the “Loonie,” is a major forex currency pair that represents the exchange rate between the US dollar and the Canadian dollar. This pair is closely watched by traders due to its sensitivity to commodity prices, particularly oil, and economic data releases from both countries. Today’s fundamental outlook for USDCAD will be significantly influenced by key economic data releases. Canada’s GDP data from Statistics Canada will provide insights into economic health and is expected to impact the Loonie’s value strongly. A higher-than-expected reading could strengthen the CAD. From the US, traders will closely watch the Producer Price Index (PPI) and the Chicago Purchasing Managers’ Index (PMI), both indicating inflationary pressures and economic activity. Positive figures here would support bullish sentiment for the USD, potentially influencing the USD-CAD price action.
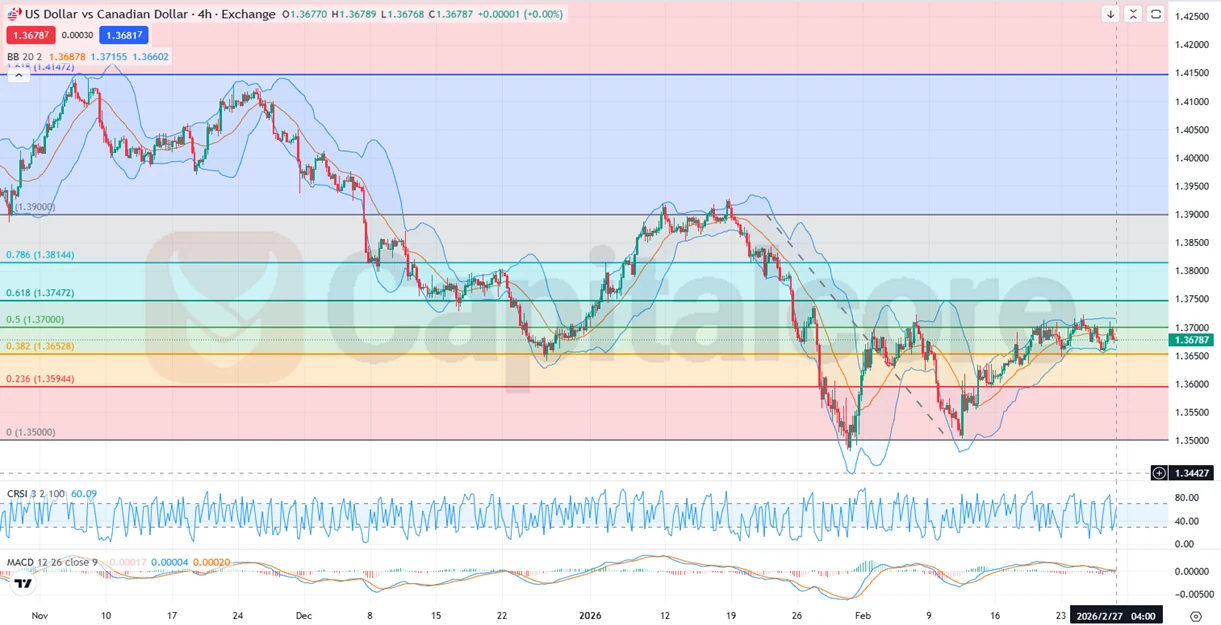
Chart Notes:
• Chart time-zone is UTC (+02:00)
• Candles’ time-frame is 4h
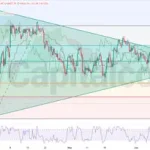
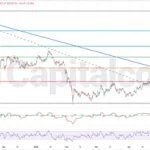
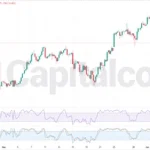
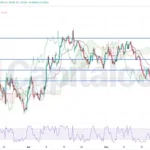
Analyzing the USD-CAD H4 chart, the currency pair is displaying bullish short-term price action within an overarching bearish long-term trend. Currently, price is oscillating between the Fibonacci retracement levels of 0.5 and 0.382, closely tracking within the upper half of the Bollinger Bands, between the middle and upper lines. This indicates moderate bullish momentum within a broader bearish context. The CRSI indicator stands at 60.09, showing neutral to slightly bullish strength, while MACD values (-0.00017, 0.00004, and 0.00020) suggest mild bullish momentum with potential crossover signals. Traders should closely monitor these technical indicators for further clarity on potential price movements.
•DISCLAIMER: Please note that the above analysis is not an investment suggestion by “Capitalcore LLC”. This post has been published only for educational purposes.