Retail Sales Boost USD But CAD in Focus
The USD/CAD forex pair, often referred to by traders as the “Loonie,” represents the exchange rate between the US Dollar and the Canadian Dollar. As a commodity-linked currency, the Canadian Dollar is heavily influenced by crude oil prices, while the US Dollar reacts to broader macroeconomic data and Fed policy. Together, this pair is highly sensitive to economic divergence and central bank developments.
Today’s economic calendar is packed with high-impact events that could shape the short-term outlook of the USDCAD daily chart. From the U.S. side, stronger-than-expected Retail Sales data (1.3% vs. 0.2% forecast) may provide a short-term bullish impulse to the greenback. However, disappointing figures in Industrial Production (-0.2% vs. 0.7%) and a slight dip in Capacity Utilization Rate could cap gains. More importantly, speeches from Fed Chair Powell and FOMC members later in the day could influence USD volatility significantly. On the Canadian front, the BOC Rate Statement and Monetary Policy Report, followed by the BOC Press Conference, will be key. With no rate change expected (2.75%), traders will focus on forward guidance. Hawkish signals may support CAD strength, adding pressure to USDCAD. In the broader context of price action and fundamental analysis, the balance of today’s news favors high volatility with potential bearish continuation on the H4 chart if the BOC leans hawkish while the Fed remains cautious.
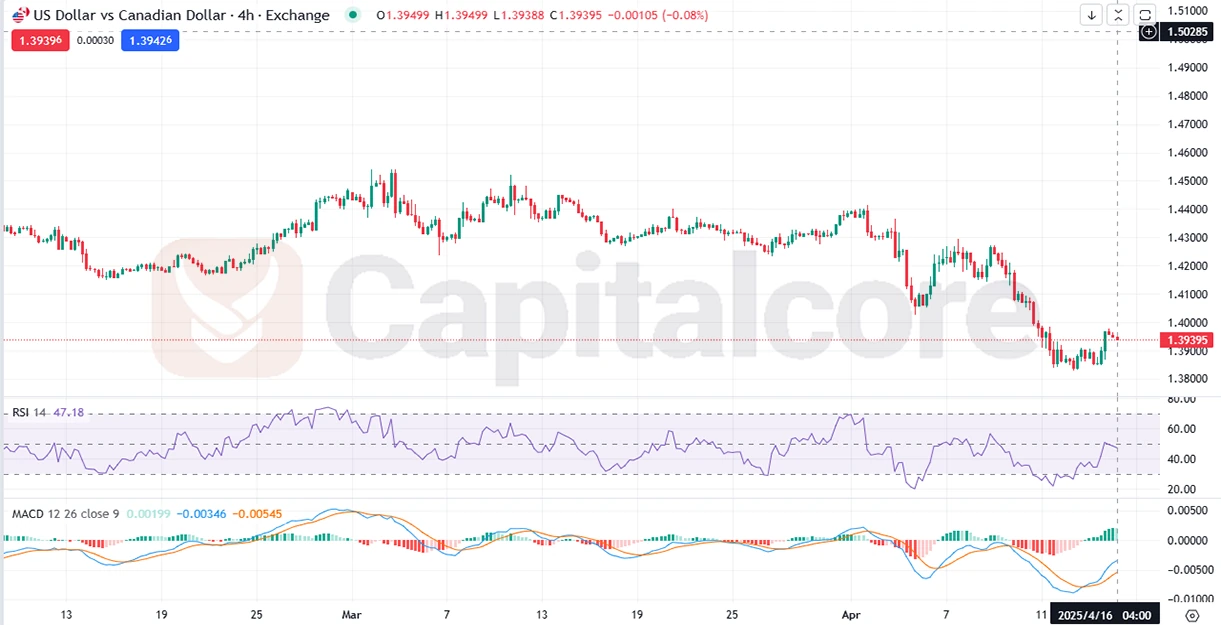
Chart Notes:
• Chart time-zone is UTC (+03:00)
• Candles’ time-frame is 4h.
On the 4-hour timeframe of the USDCAD chart, the recent market structure reflects a strong and sustained bearish trend, which emerged following a brief but noticeable bullish retracement. This upward correction, though short-lived, was met with heavy resistance, causing the price to stall and eventually resume its downward trajectory. After testing and rebounding from a key support zone around the 1.38300 mark, the pair made an attempt to regain higher levels. However, this move appears to have lost steam, and current candlestick behavior indicates a likely continuation of the broader bearish momentum. Looking at technical indicators, the Relative Strength Index (RSI) is currently sitting near 47, which is a neutral level that typically signals market indecision. This reading suggests that the pair lacks the bullish strength required for a meaningful reversal, as the RSI is neither oversold nor overbought. It remains caught in a range, offering little confirmation of bullish divergence.
Simultaneously, the Moving Average Convergence Divergence (MACD) indicator paints a similar picture: the MACD line remains below the signal line, while the histogram bars are diminishing in size, further reinforcing the presence of bearish momentum and a lack of buying pressure. In terms of key price levels, the most immediate support lies at 1.39000, which has acted as a minor pivot point in recent sessions. Should selling pressure intensify—particularly in response to today’s fundamental developments favoring the Canadian Dollar—this level may come under renewed threat. A break below it could expose the next major support at 1.38250, a level that previously acted as a strong demand zone. On the flip side, short-term resistance is seen at 1.39800, with a more significant ceiling at 1.40000. Any bullish push toward these zones would need to be backed by strong economic catalysts or a notable shift in sentiment to disrupt the current bearish trend. Until such a move materializes, the overall bias on the USDCAD daily chart remains tilted toward further downside, supported by both price action and technical indicators.
• DISCLAIMER: Please note that the above analysis is not an investment suggestion by “Capitalcore LLC”. This post has been published only for educational purposes.
