Bollinger Bands USDCHF Forex Market Trends
USD/CHF, commonly known as the “Swissie,” represents the pairing of the US Dollar and the Swiss Franc. It is widely traded due to its stability and correlation with global economic conditions. Fundamentally, today’s focus is on the upcoming speeches from Federal Reserve Governor Christopher Waller, who will deliver both opening and closing remarks at the Federal Reserve Board Payments Innovation Conference. Traders closely monitor these speeches as hawkish comments typically strengthen the USD by signaling tighter monetary policy. Additionally, Switzerland’s trade balance figures, reflecting export-import activities, are pivotal since stronger-than-expected exports can boost CHF value. Thus, traders should be cautious and remain alert for potential volatility influenced by these announcements.
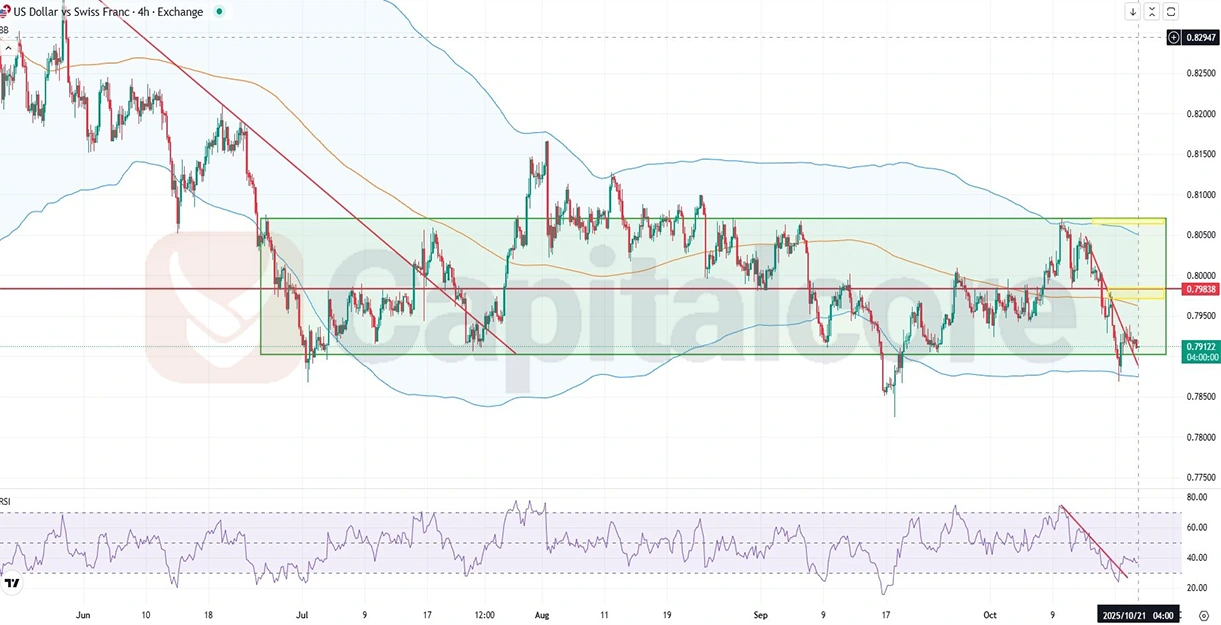
Chart Notes:
• Chart time-zone is UTC (+03:00)
• Candles’ time-frame is 4h.
Analyzing the USD/CHF H4 chart, price action demonstrates a clear sideways movement within a rectangular pattern. The pair recently touched the bottom line of this rectangle, closely aligned with the lower Bollinger Band, and subsequently broke a minor resistance line, indicating potential short-term bullish momentum towards the resistance zone around 0.79838, coinciding with the middle Bollinger Band. Should bullish momentum continue, a secondary target could be the upper boundary of the rectangle pattern near the upper Bollinger Band. The Relative Strength Index (RSI) has similarly breached its downward resistance line, signaling potential bullish correction. However, given the broader downward trend within this sideways channel, traders should exercise caution in pursuing long positions, as a resumption of bearish momentum remains likely.
•DISCLAIMER: Please note that the above analysis is not an investment suggestion by “Capitalcore LLC”. This post has been published only for educational purposes.


