Fundamental Drivers of USDNZD Today
The USDNZD forex pair, affectionately known as the “Kiwi Dollar,” represents the exchange rate between the US Dollar and the New Zealand Dollar. Today, USD/NZD is shaped by strong US economic indicators, including an ISM Services PMI rising to 53.5 from 52.1 and a slight decline in JOLTS Job Openings to 7.73M from 7.74M. Additionally, the New Zealand GDT Price Index has decreased by 2.8%, alongside the upcoming US 10-year Bond Auction yielding 4.24%, up from 2.7%. These fundamental factors suggest potential volatility in the USD NZD pair, aligning with broader USD-NZD daily chart technical and fundamental analysis trends that highlight the influence of key economic data on currency movements.
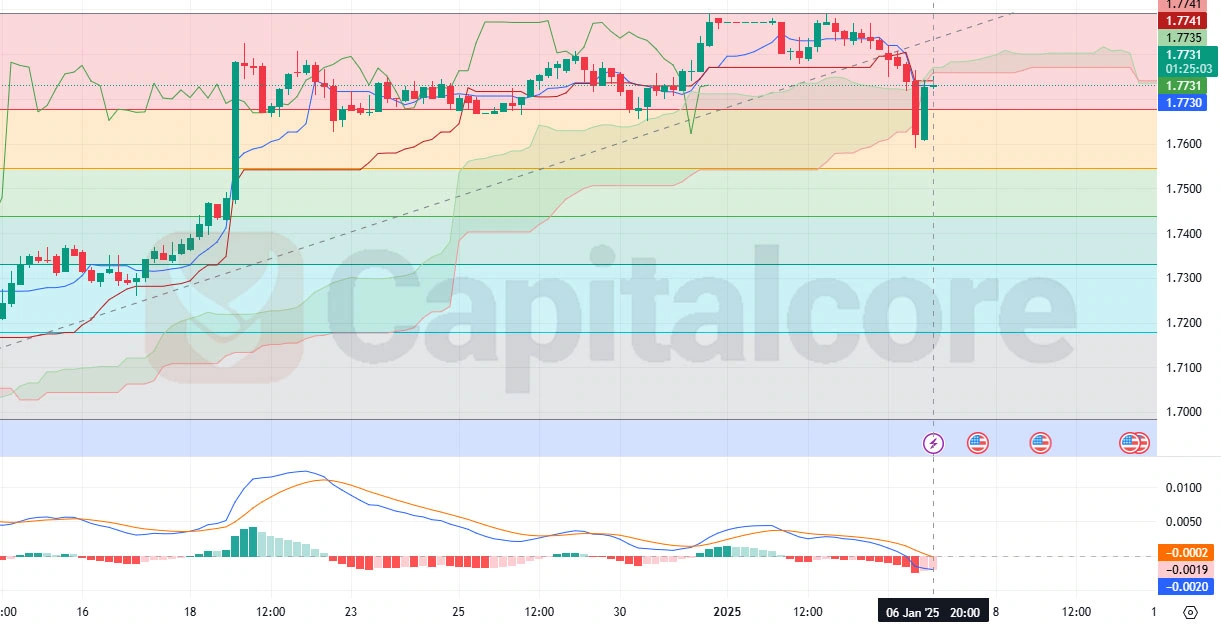
Chart Notes:
• Chart time-zone is UTC (+02:00)
• Candles’ time-frame is 4h.
Analyzing the uploaded USDNZD H4 chart, the price line has recently broken below the Ichimoku cloud, a critical signal in USDNZD price action strategies, indicating a possible bearish trend. The MACD indicator reinforces this bearish potential, suggesting that the current bullish phase may be nearing its end. This technical setup, combined with today’s fundamental news, underscores a pivotal moment for traders focusing on USD/NZD daily chart technical and fundamental analysis, as similar patterns may impact the broader forex market dynamics.
• DISCLAIMER: Please note that the above analysis is not an investment suggestion by “Capitalcore LLC”. This post has been published only for educational purposes.
