XAGUSD H4 Silver Technical Outlook GBPUSD Daily Chart
XAGUSD (Silver) is the spot price of silver quoted against the US dollar and is often nicknamed the White Metal or the Poor Mans Gold because it behaves like a precious metal hedge but trades with higher volatility than gold. As a liquid forex commodity pair XAGUSD is watched by traders for safe haven flows and inflation hedging which makes GBPUSD daily chart technical analysis and USD moves especially relevant for its price action today. Fundamental drivers today center on comments from Federal Reserve Governor Michelle Bowman who is due to speak which could inject hawkish or dovish cues into USD sentiment and therefore materially affect silver; a more hawkish tone would likely strengthen the US dollar and cap XAGUSD upside while dovish remarks would tend to weaken USD and fuel a silver rally, so watch real time headlines and market reaction alongside weekly energy data and API releases that can shift risk appetite and inflation expectations; importantly traders should monitor GBPUSD daily chart technical and fundamental analysis too because a stronger GBPUSD (weaker USD) can indirectly support XAGUSD price action creating correlation opportunities for cross market trading.
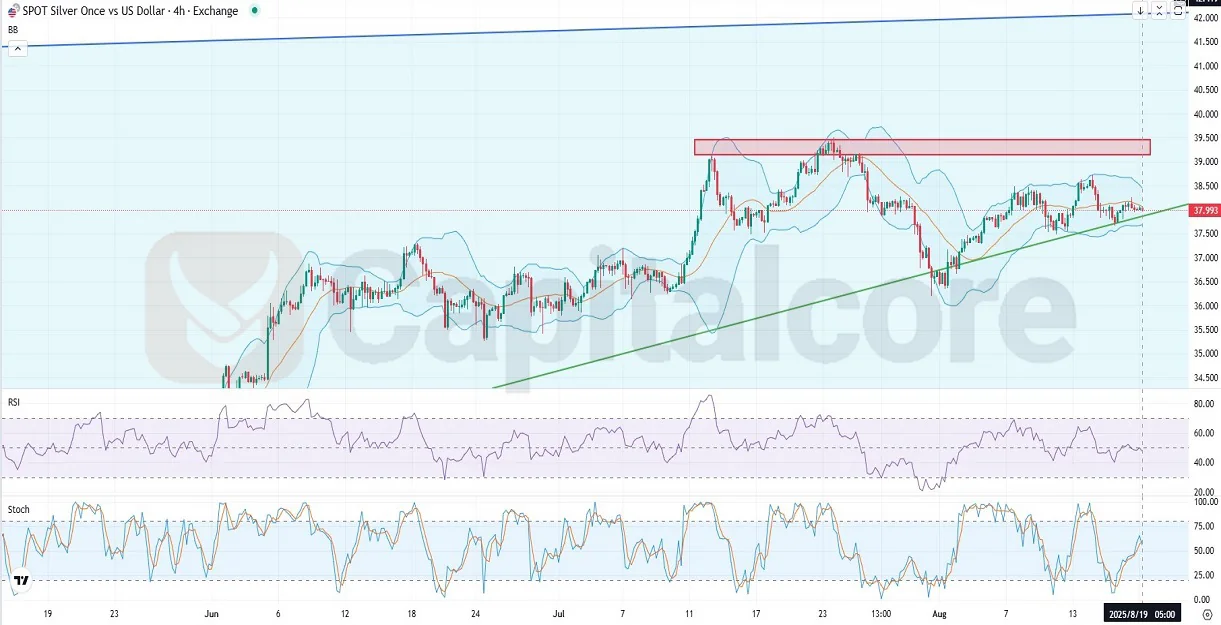
Chart Notes:
• Chart time-zone is UTC (+03:00)
• Candles’ time-frame is 4h.
On the H4 chart the bias is mildly bullish with price trading around 37.99 and tracing an ascending trendline that has offered repeated support while a clear resistance zone sits at roughly 39.0 to 39.5 followed by the long term channel top near 42; Bollinger Bands are contracting indicating a volatility squeeze and a potential breakout setup, RSI sits comfortably around the mid 50s showing a neutral to slightly bullish momentum, and Stochastic is above 50 moving toward the 70 region which signals building upside momentum but not yet overbought; a clean break above 39.5 would open the path toward the channel upper band near 42 while failure or a USD driven hawkish shock could push price back to the trendline and lower Bollinger band near the mid 36s so combine this H4 technical view with GBPUSD daily chart technical analysis and broader fundamental flow before committing.
•DISCLAIMER: Please note that the above analysis is not an investment suggestion by “Capitalcore LLC”. This post has been published only for educational purposes.


