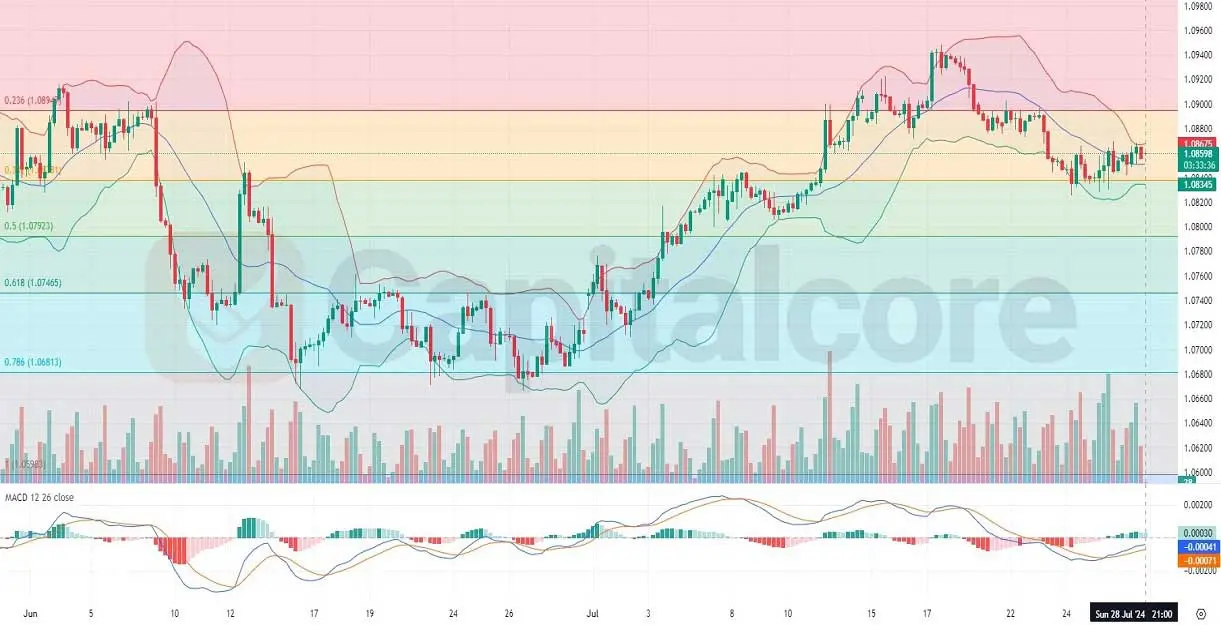
EURUSD H4 Chart Insights and Predictions
The EURUSD forex pair, often nicknamed “Fiber,” is a popular currency pair in trading, representing the euro against the U.S. dollar. This pair is heavily influenced by economic indicators from both the Eurozone and the United States, making it a prime choice for traders seeking to capitalize on macroeconomic trends. Today’s focus is on the upcoming Eurozone Consumer Confidence report and the U.S. Pending Home Sales data, both of which are expected to create significant market movements.

Chart Notes:
• Chart time-zone is UTC (+03:00)
• Candles’ time-frame is 4h.
The H4 chart for EURUSD shows several key technical indicators: Bollinger Bands, Volume, MACD, and Fibonacci Retracement levels. The Bollinger Bands have tightened, indicating reduced volatility, while the price has moved from the lower half toward the upper half of the bands and is currently fluctuating within the upper half. This suggests a generally positive trend with a mixture of bullish and bearish candles. The MACD indicator shows a potential bullish crossover, reinforcing the likelihood of a continued upward movement. Fibonacci retracement levels highlight key support and resistance areas, with the price recently testing and moving above the 50% retracement level, suggesting a potential further upward trend.
• DISCLAIMER: Please note that the above analysis is not an investment suggestion by “Capitalcore LLC”. This post has been published only for educational purposes.


