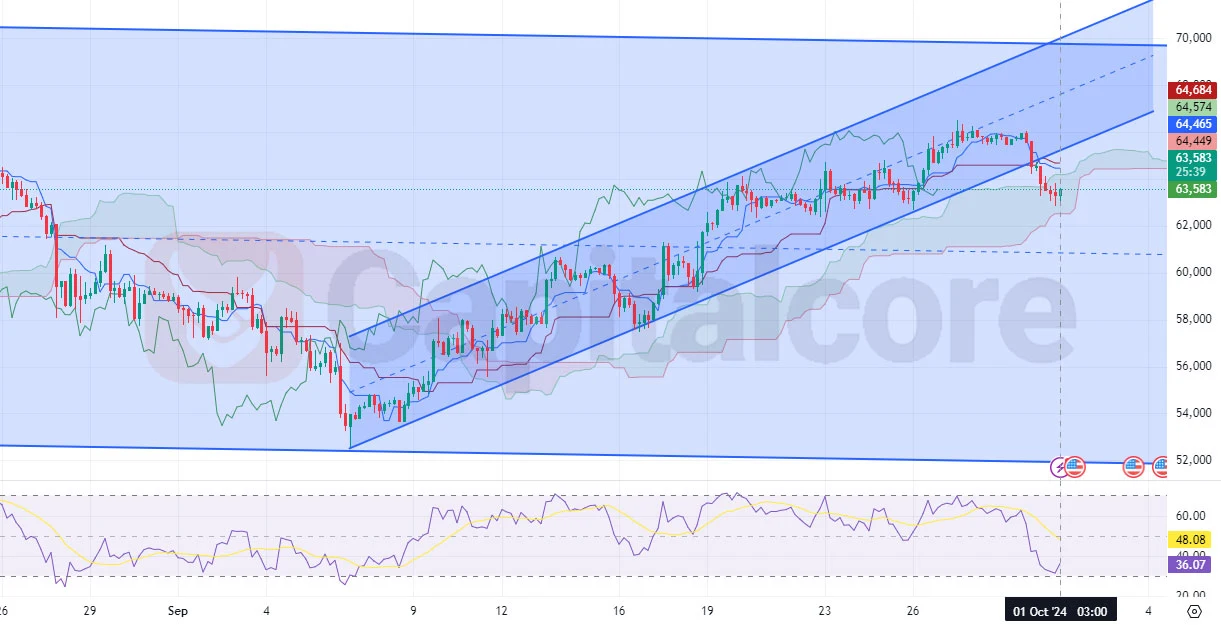
Bitcoin Analysis: Cloud Break Signals Bearish
Bitcoin (BTC) is one of the most actively traded cryptocurrencies, and its price is closely followed by traders and investors worldwide. In the current analysis, the BTC/USD price is trading within an upward channel, showing a general bullish trend. However, the recent pullback has brought the price near the lower boundary of the channel, just above the Ichimoku cloud. If the price breaks below this cloud, it could signal the continuation of a bearish wave, possibly pushing BTC lower. Traders should watch for a break below the Ichimoku cloud as a key bearish signal.

Chart Notes:
• Chart time-zone is UTC (+03:00)
• Candles’ time-frame is 4h.
The RSI on the chart indicates a bearish momentum, currently sitting around 36, showing that the BTC price may be approaching oversold conditions. This could provide some short-term support, but if the price fails to hold above the current support level of around $63,000, a further decline could follow. Traders looking for BTC analysis, Bitcoin price forecast, and BTC price predictions should monitor this chart closely, as a confirmed break below the cloud could lead to deeper corrections toward the $60,000 level.
• DISCLAIMER: Please note that the above analysis is not an investment suggestion by “Capitalcore LLC”. This post has been published only for educational purposes.


