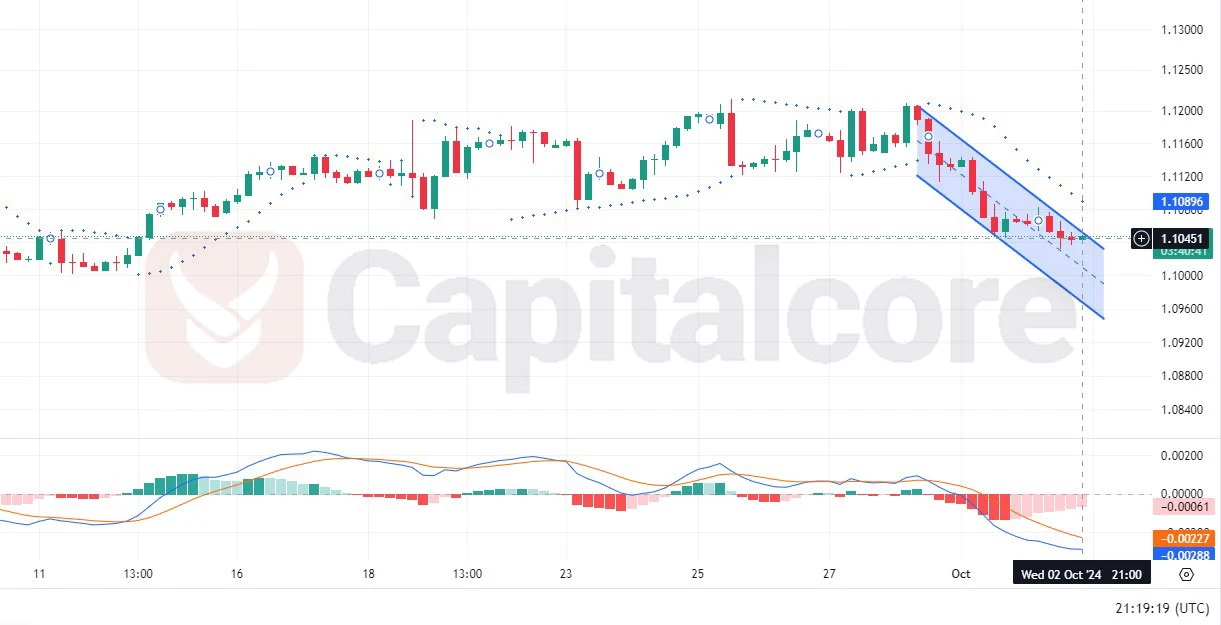
EUR/USD H4: Indicators Suggest Further Downside
The EUR/USD forex pair, often called the “Fiber,” is one of the most widely traded currency pairs globally, representing the strength of the Euro against the U.S. dollar. Forex traders closely watch macroeconomic indicators from both economies, including inflation, interest rates, and economic growth metrics, as they are key drivers of EURUSD market movements. Today, a key focus for EUR/USD traders is the Purchasing Managers’ Index (PMI) from both the Eurozone and the U.S. A PMI reading above 50 for the Eurozone indicates economic expansion, while a figure below 50 would signal contraction, likely affecting the euro’s strength. Meanwhile, U.S. labor data, particularly the jobless claims report, can influence the dollar depending on how the figures compare to market forecasts.

Chart Notes:
• Chart time-zone is UTC (+03:00)
• Candles’ time-frame is 4h.
On the EUR/USD H4 chart, the pair’s price action shows a clear downtrend within a descending channel. The last five candles have displayed mixed momentum, with three bullish green candles followed by two bearish red candles. The Parabolic SAR dots are positioned above the price, indicating continued selling pressure and the Fiber’s bearish outlook. Additionally, the MACD indicator is showing a bearish bias, with the histogram in negative territory and both the MACD and signal lines trending downward. This suggests that the bearish momentum may persist in the near term as long as the price remains under pressure from both the Parabolic SAR and the weakening MACD.
DISCLAIMER: Please note that the above analysis is not an investment suggestion by “Capitalcore LLC”. This post has been published only for educational purposes.


