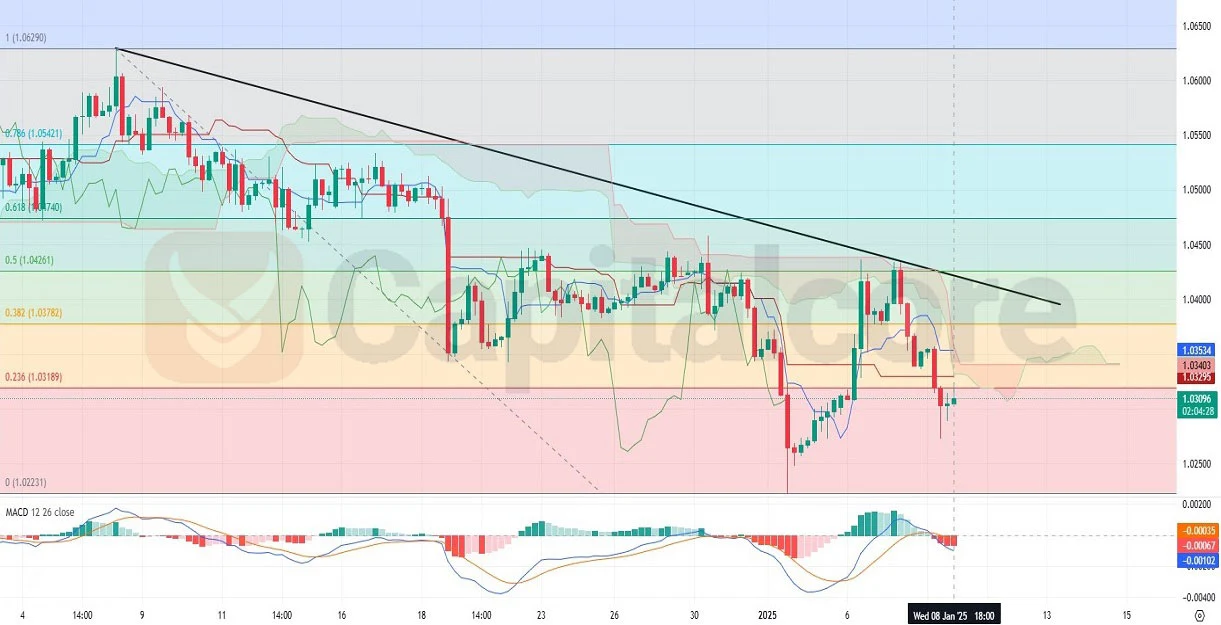
Bearish Momentum in EUR/USD Price Action
The EURUSD, commonly referred to as “Fiber,” is one of the most traded currency pairs globally, representing the euro against the US dollar. As of today, the market is particularly sensitive to incoming data, including Germany’s industrial production figures and the European Central Bank’s economic bulletin. On the US side, upcoming speeches by Federal Reserve officials and job cut announcements will also influence the EUR-USD pair. German industrial production and foreign trade data, both due today, are key as they act as leading indicators for Eurozone economic health. Simultaneously, Federal Reserve speeches will shape expectations for US monetary policy. If German data surprises positively or ECB officials adopt a hawkish tone, the euro might gain; however, a more hawkish Federal Reserve could strengthen the dollar, applying downward pressure on EUR/USD.

Chart Notes:
• Chart time-zone is UTC (+02:00)
• Candles’ time-frame is 4h.
In the H4 chart, the EUR USD is in a bearish trend, characterized by a descending trendline and bearish candles. However, recent price action shows two bullish candles attempting to break the 0.236 Fibonacci retracement level near 1.0319. The Ichimoku Cloud indicates the price is below the cloud, suggesting resistance, though it appears to be consolidating near the Fibonacci level. The MACD histogram displays increasing bullish momentum, and the MACD lines are converging, hinting at a potential reversal. Still, the overall bearish trend and the strong resistance posed by the Fibonacci retracement level suggest caution for bullish trades.
• DISCLAIMER: Please note that the above analysis is not an investment suggestion by “Capitalcore LLC”. This post has been published only for educational purposes.


