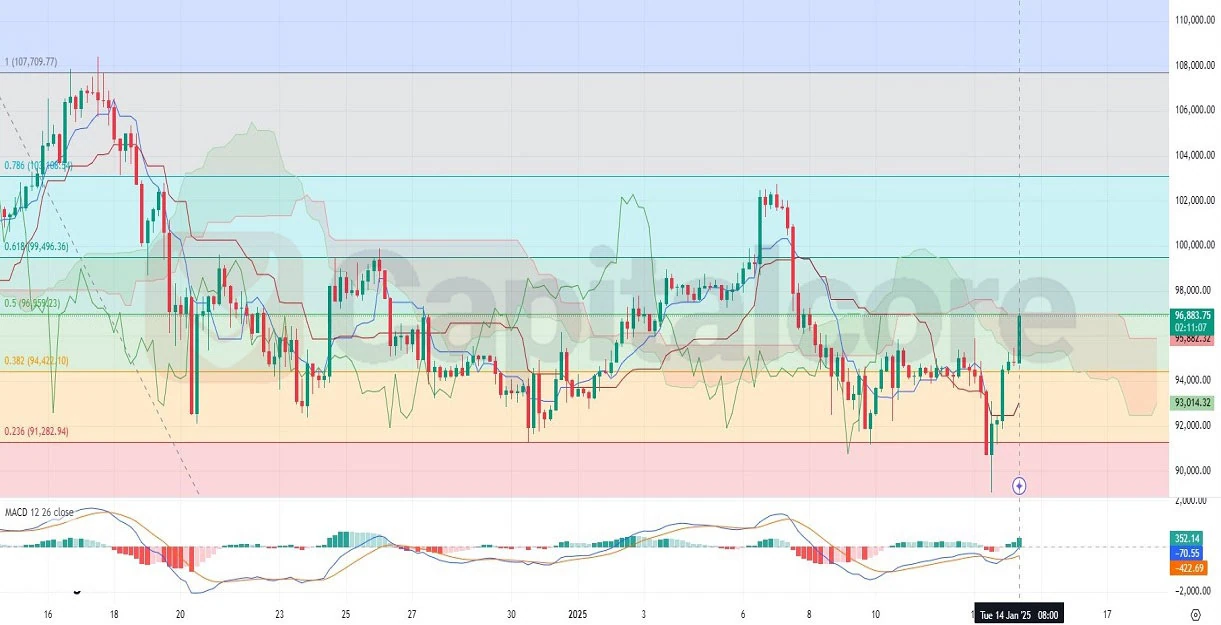
BTCUSD Analysis with Ichimoku and Fibonacci Levels
Bitcoin, often nicknamed “Digital Gold,” is paired with the US Dollar (BTCUSD), creating one of the most watched forex and cryptocurrency trading pairs in global markets. BTCUSD represents the exchange rate between the decentralized cryptocurrency Bitcoin and the fiat USD, showcasing its susceptibility to both crypto-specific developments and USD macroeconomic trends. Today, key USD-related events such as the Producer Price Index (PPI), NFIB business sentiment, and a speech by a Federal Reserve member will likely influence market dynamics. A higher-than-expected PPI indicates inflationary pressure, which could strengthen the USD and potentially dampen BTCUSD’s bullish movements. Conversely, dovish signals from Federal Reserve commentary could support Bitcoin’s bullish recovery.

Chart Notes:
• Chart time-zone is UTC (+02:00)
• Candles’ time-frame is 4h.
The BTC USD H4 chart indicates significant bullish momentum as recent candles sharply increased, breaking through key resistance levels. Initially moving below the Ichimoku Cloud, the BTC/USD price has now pierced the lower boundary and is challenging the upper boundary near the Fib 0.5 retracement level. The Fib 0.5 level aligns with the cloud’s top line, creating a critical resistance zone. Concurrently, the MACD indicator and histogram show bullish crossovers, signaling increasing bullish momentum. If BTC-USD manages to close above this confluence zone, it could aim for higher Fibonacci levels. However, failure to break above this level may result in consolidation or a retracement.
• DISCLAIMER: Please note that the above analysis is not an investment suggestion by “Capitalcore LLC”. This post has been published only for educational purposes.


