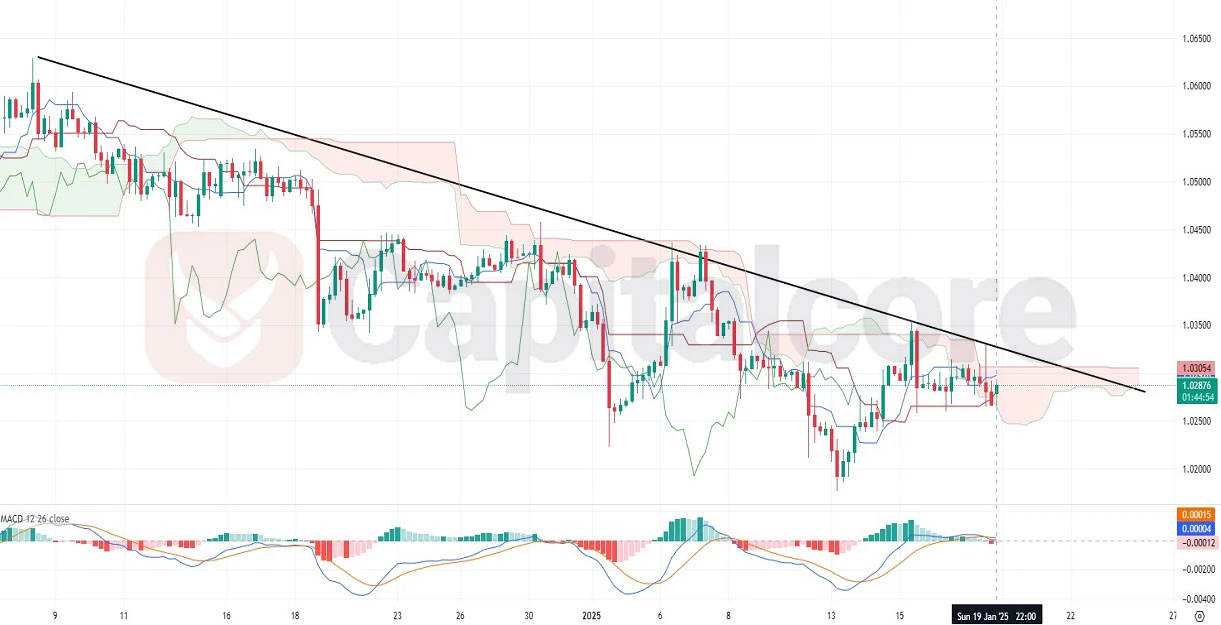
Bearish Momentum Challenges EUR/USD Price Breakout
The EUR USD currency pair, also known as “Fiber,” represents the exchange rate between the Euro and the US Dollar and is the most traded currency pair in the forex market. As a barometer of the Eurozone and US economies, it often reacts to macroeconomic data and geopolitical events. Today, the Eurozone’s Producer Price Index (PPI) and insights from the World Economic Forum (WEF) and Eurogroup discussions could provide key economic clues. The PPI’s influence on inflation and remarks from influential figures at Davos may steer the Euro’s direction. On the other side, US markets observe Martin Luther King Jr. Day, signaling low liquidity and irregular volatility for the Dollar.
 Chart Notes:
• Chart time-zone is UTC (+02:00)
• Candles’ time-frame is 4h.
The uploaded EUR/USD H4 chart highlights a prevailing bearish trend, with four bearish candles in the last six sessions. Despite the bearish momentum, recent bullish candles suggest a potential attempt to reverse. The EUR-USD price is currently in the middle of the Ichimoku cloud, attempting to break above it. The flat upper cloud line reflects indecisiveness, often an indication of consolidation. The MACD indicator shows bullish momentum, with the histogram turning positive and MACD lines crossing upward. However, the broader trend remains bearish, and a decisive break above the cloud will be needed for confirmation of a trend reversal.
• DISCLAIMER: Please note that the above analysis is not an investment suggestion by “Capitalcore LLC”. This post has been published only for educational purposes.


