EURUSD H4 Fibonacci Levels and RSI Momentum
The EUR/USD, commonly known as the “Fiber,” is the most traded currency pair in the forex market, representing the exchange rate between the Euro and the US Dollar. Due to its high liquidity and volatility, it attracts traders globally, reacting sharply to economic indicators from both the Eurozone and the United States. As investors assess macroeconomic conditions, monetary policies from the European Central Bank (ECB) and the Federal Reserve (Fed) play a crucial role in the pair’s price action. Today’s upcoming economic news for EUR/USD will be a major driver of volatility. Key reports such as U.S. Non-Farm Payrolls (NFP), Initial Jobless Claims, and Eurozone Retail Sales will dictate the pair’s direction. A stronger-than-expected NFP report could boost the USD, pushing EURUSD lower, while weaker data might fuel a bullish reaction in favor of the Euro. Additionally, the ECB’s stance on monetary tightening, combined with the Federal Reserve’s signals on rate hikes or potential cuts, will influence sentiment. If inflation concerns persist in the Eurozone, the ECB might adopt a hawkish stance, supporting the Euro, whereas dovish comments from Fed officials could weaken the Dollar, driving EUR-USD higher.
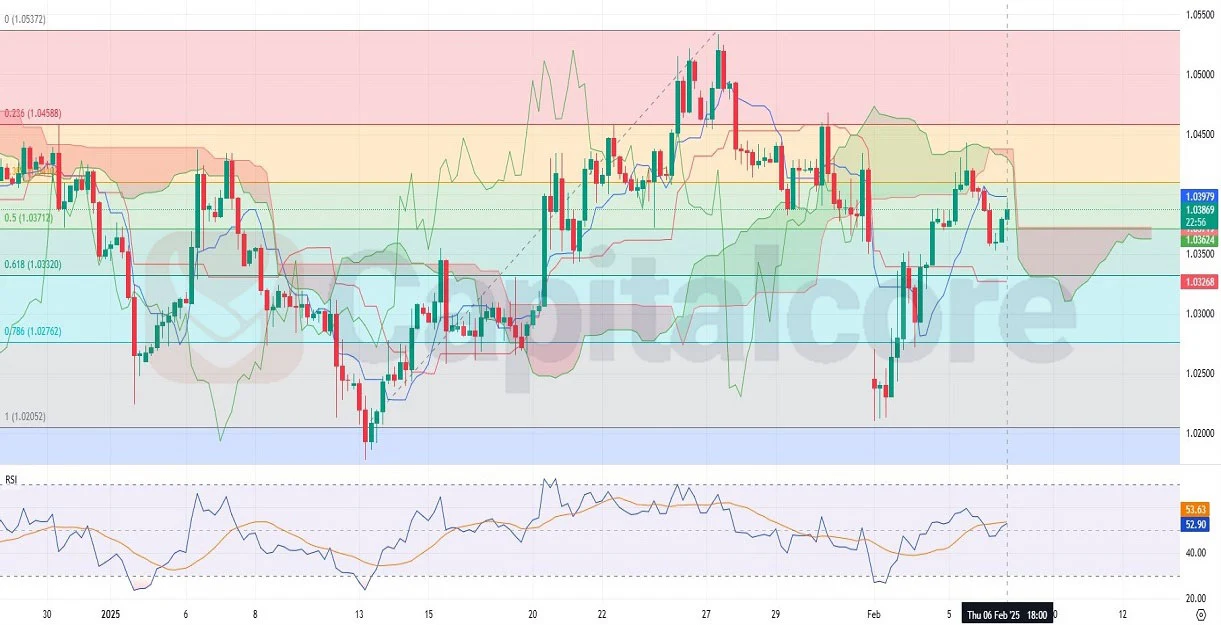
Chart Notes:
• Chart time-zone is UTC (+02:00)
• Candles’ time-frame is 4h.
The EUR/USD H4 chart presents a mixed technical outlook with key indicators providing crucial signals. The Ichimoku Cloud suggests a resistance zone, as the Leading Span B line is moving horizontally, indicating uncertainty. Despite the fact that the price remains below the cloud, the last three candles have been bullish, suggesting a potential upward push toward the cloud. The 0.50 Fibonacci retracement level is acting as a support after the price successfully breached it, indicating a solid base for further gains. However, EUR USD is currently facing resistance at the 0.382 Fibonacci level, which could be a crucial test for bullish momentum. If buyers manage to break above this level, the price could extend its gains toward the 0.236 Fibonacci level, around 1.0458. Additionally, the Relative Strength Index (RSI) is hovering around 53-54, signaling moderate bullish momentum but not yet in overbought territory. If RSI continues to rise above 60, it could confirm further bullish momentum, increasing the chances of a breakout above the current resistance levels.
• DISCLAIMER: Please note that the above analysis is not an investment suggestion by “Capitalcore LLC”. This post has been published only for educational purposes.
