GBPJPY Technical and Fundamental Outlook Today
The GBP-JPY currency pair, also known as “The Dragon,” is a highly volatile forex pair that combines the British Pound (GBP) and the Japanese Yen (JPY). This pair is influenced by economic indicators from both the UK and Japan, central bank policies, and overall market sentiment. With high liquidity and strong price movements, GBP JPY is a favorite among traders seeking dynamic price action opportunities. Fundamental analysis for GBPJPY today focuses on key economic releases from both the UK and Japan. Japan’s Machine Orders data, a leading indicator of manufacturing activity, and the Adjusted Merchandise Trade Balance report will provide insight into the health of Japan’s economy. Strong data could bolster the JPY, pressuring GBP/JPY lower. Meanwhile, UK inflation figures, including CPI, Core CPI, PPI, and RPI, are set to be released, with expectations of sustained inflationary pressures potentially influencing the Bank of England’s monetary policy stance. If inflation exceeds forecasts, speculation around higher interest rates could strengthen GBP, driving GBP-JPY higher. The bond market’s reaction to the 30-year Gilt Auction will also play a role in market sentiment. With these upcoming events, GBPJPY remains poised for volatility, and traders should closely monitor the actual results against forecasts to gauge market direction.
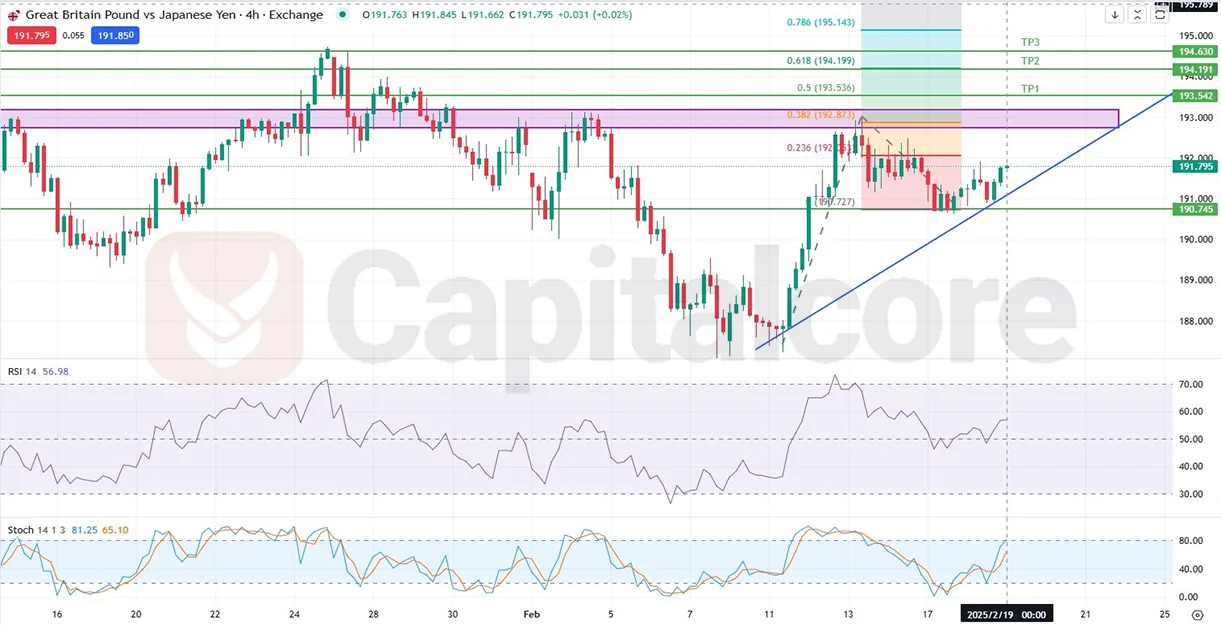
Chart Notes:
• Chart time-zone is UTC (+02:00)
• Candles’ time-frame is 4h.
On the GBP/JPY H4 chart, after a strong uptrend, the price tested a significant resistance zone and failed to break through, forming an Evening Star candlestick pattern, a strong bearish reversal signal. The price reacted to the support level at 190.74 before making another attempt towards the resistance zone. If GBP vs. JPY successfully breaks above this zone, Fibonacci extension levels suggest potential targets at TP1, TP2, and ultimately TP3. However, failure to break above could see a retest of the support level. Traders should monitor price action and key indicators, including RSI and Stochastic, which suggest that the pair is in a neutral to slightly bullish zone but approaching overbought conditions. The RSI is currently at 56.98, indicating room for further price movement before hitting extreme levels, while the Stochastic indicator shows a K-line of 81.25 and a D-line of 65.10, suggesting that GBP/JPY is nearing overbought territory. If the pair continues to rally towards 193.5, these indicators will confirm whether a breakout or rejection is more likely. Additionally, moving averages should be monitored for trend confirmation to refine trading strategies.
•DISCLAIMER: Please note that the above analysis is not an investment suggestion by “Capitalcore LLC”. This post has been published only for educational purposes.
