EURGBP Bearish Momentum What Traders Should Watch Next
EUR/GBP, commonly known as the “Chunnel”, is a highly liquid forex pair influenced by macroeconomic events in both the Eurozone and the UK. Its volatility is driven by key economic releases, central bank policies, and global risk sentiment. Today, major Eurozone economic data, including the IFO Business Climate Index from Germany, will provide insight into economic confidence and growth expectations. Stronger-than-expected figures could boost the euro, while weak data may weigh on the currency. Additionally, Eurostat’s Core CPI and CPI reports will reveal inflation trends, which are crucial for ECB rate decisions—higher-than-expected inflation could reinforce ECB hawkishness and support EUR. On the GBP side, multiple Bank of England (BOE) speeches will be closely monitored for policy guidance. If BOE policymakers adopt a hawkish tone, the pound may gain strength, adding further downside pressure to EUR GBP. Given the importance of these events, traders should brace for potential high volatility and price action shifts throughout the session.
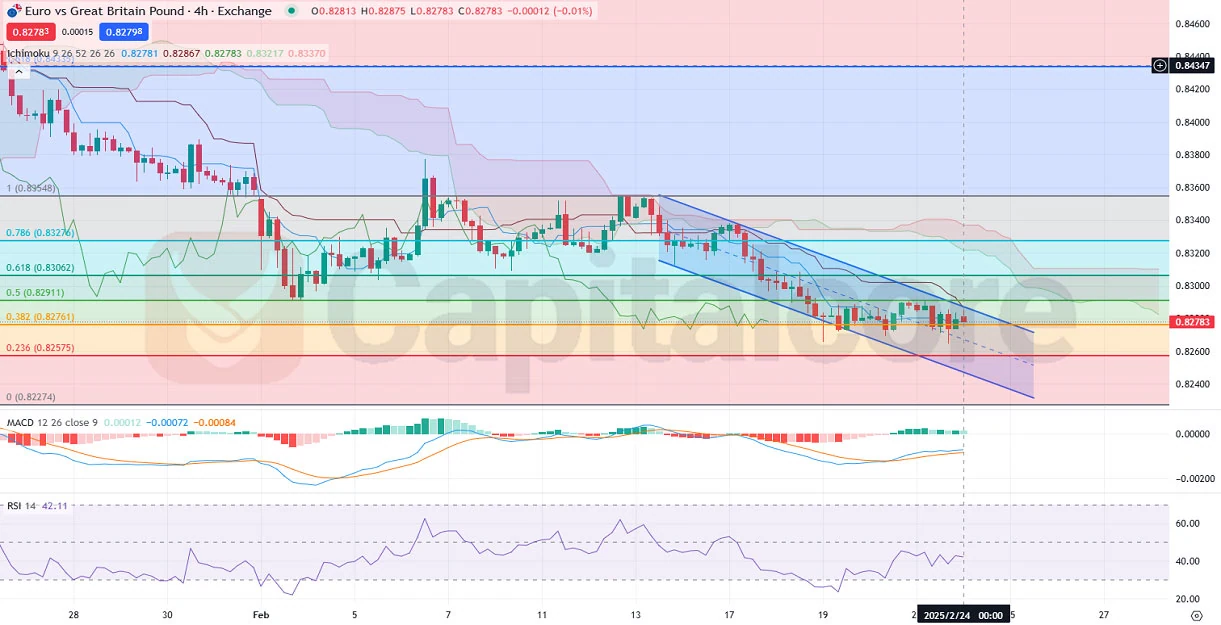
Chart Notes:
• Chart time-zone is UTC (+02:00)
• Candles’ time-frame is 4h.
The EURGBP H4 chart indicates a strong bearish trend, with price action confined within a downward-sloping channel. The Ichimoku Cloud remains red, signaling bearish momentum, and candles continue to trade below the cloud, confirming the downward trend. The latest candle is also bearish, indicating persistent selling pressure. The MACD lines are converging, with the histogram showing a weakening bearish momentum—potentially signaling a near-term consolidation or reversal. The RSI at 42.11 suggests the EUR-GBP pair is nearing oversold conditions, but there is still room for further downside. Additionally, the Chunnel price is currently hovering between the 0.5 and 0.382 Fibonacci retracement levels, which are key support areas. Notably, the Ichimoku base line (Kijun-sen) has touched the last candle’s top shadow, which often acts as dynamic resistance. If the price fails to break above this level, further downside movement towards 0.8260 or lower is likely. Traders should watch for a break below 0.8257 (23.6% Fib retracement) for further bearish continuation, while a break above 0.8306 (61.8% Fib) may signal a reversal.
• DISCLAIMER: Please note that the above analysis is not an investment suggestion by “Capitalcore LLC”. This post has been published only for educational purposes.
