AUDUSD Currency Analysis and Market Predictions
The AUD-USD currency pair, often nicknamed the “Aussie,” represents the Australian dollar against the US dollar and is heavily influenced by commodities and interest rate differentials between the Reserve Bank of Australia (RBA) and the US Federal Reserve. Today’s fundamental landscape is particularly significant, with key speeches by FOMC members Thomas Barkin, Raphael Bostic, and Alberto Musalem, potentially driving USD strength if a hawkish tone emerges. Traders will closely monitor these speeches for signals on future US monetary policy adjustments, which may affect volatility and directional bias in AUDUSD price action today. Meanwhile, no major Australian data releases are scheduled today, leaving AUDUSD fundamentally susceptible primarily to USD-driven market moves.
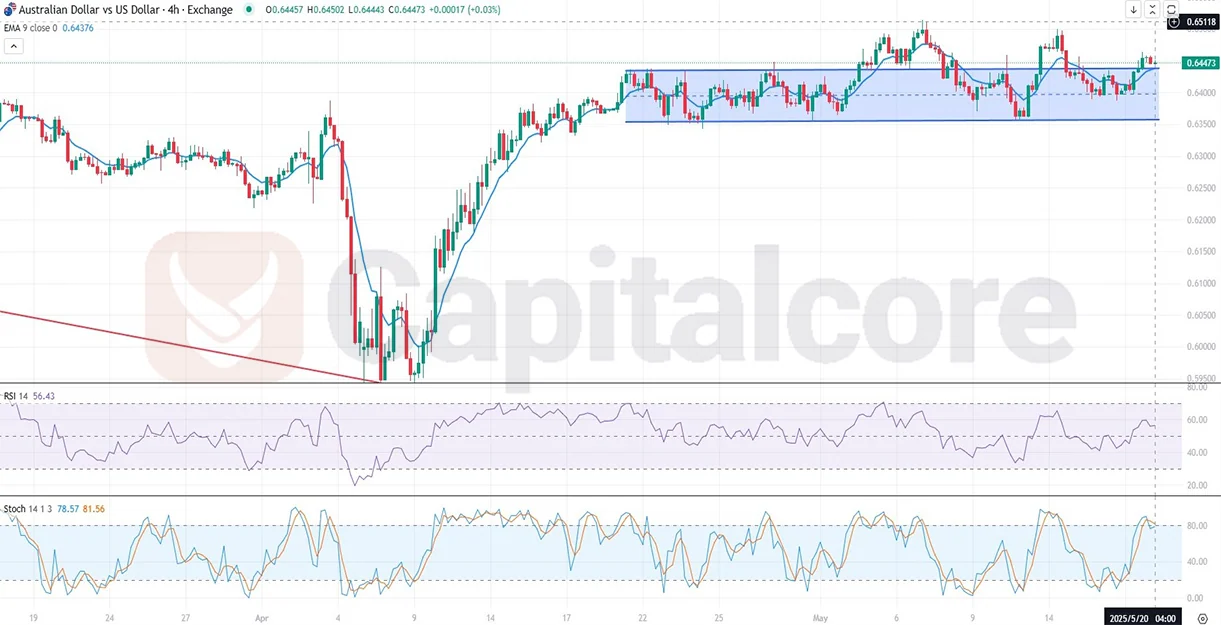
Chart Notes:
• Chart time-zone is UTC (+03:00)
• Candles’ time-frame is 4h.
Analyzing the AUD/USD H4 chart, after breaking a robust downward trend line, the price has transitioned into an upward trend. Currently, the pair is consolidating within a sideways channel, indicating indecision. Given the preceding bullish trend, price action suggests a higher probability of breaking above the upper boundary of the channel, supported by the Exponential Moving Average (EMA) pointing upwards, indicating bullish momentum continuation. The RSI indicator remains neutral, reflecting the current consolidation, while the Stochastic Oscillator signals potential bullish crossover, aligning with upward breakout potential. Traders should carefully observe price reactions at channel boundaries for clear breakout confirmations.
• DISCLAIMER: Please note that the above analysis is not an investment suggestion by “Capitalcore LLC”. This post has been published only for educational purposes.
