Upcoming US Data Could Drive Volatility
ND100_NASDAQ, commonly referred to by traders as “NQ,” is a premier benchmark for US technology stocks, reflecting market sentiment toward major tech giants. With a series of high-impact US economic events on the horizon, including speeches by US President Donald Trump about auto tariffs, quarterly GDP figures, Jobless Claims, and other key data points such as Trade in Goods and Pending Home Sales, the ND100_NASDAQ daily chart technical and fundamental analysis is poised for heightened volatility. Investors will be closely monitoring how these announcements shape risk appetite and price action, as GDP and labor-market indicators can significantly shift market sentiment, while any unexpected policy comments from the White House could further influence the overall outlook for this tech-heavy index.
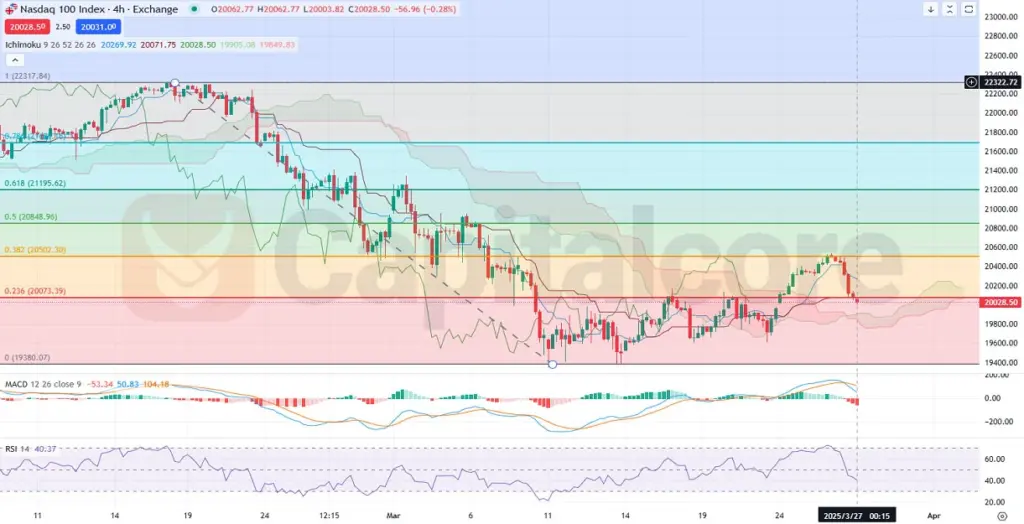
Chart Notes:
• Chart time-zone is UTC (+02:00)
• Candles’ time-frame is 4h.
On the ND100_NASDAQ H4 chart, the last seven candles have been decisively bearish, all printing in red and pushing the price action down to the 0.236 Fibonacci level. This move appears to be breaking below that Fib support and heading toward the 0 Fib area, aligning with the Ichimoku cloud. Although the candles remain above the cloud for now, the current bearish momentum is driving them closer to a potential retest of this zone, signaling a possible trend shift. Both the MACD and RSI also reflect weakening momentum, reinforcing the bearish tone in the ND100 daily chart technical and fundamental analysis.
• DISCLAIMER: Please note that the above analysis is not an investment suggestion by “Capitalcore LLC”. This post has been published only for educational purposes.
