Critical Resistance Challenges BTCUSD Price Action
BTCUSD, often referred to as “Digital Gold,” is a key bridge between the cryptocurrency market and traditional currencies, attracting both retail and institutional interest. In light of today’s USD labor-market releases—including Non-Farm Payrolls, Unemployment Rate, and Labor Inflation figures—BTCUSD daily chart technical and fundamental analysis suggests heightened volatility ahead as job creation, unemployment data, and factory orders can significantly influence USD strength, thus impacting BTC USD price action by either reinforcing the current bullish momentum or triggering profit-taking if the actual figures deviate from forecasts.
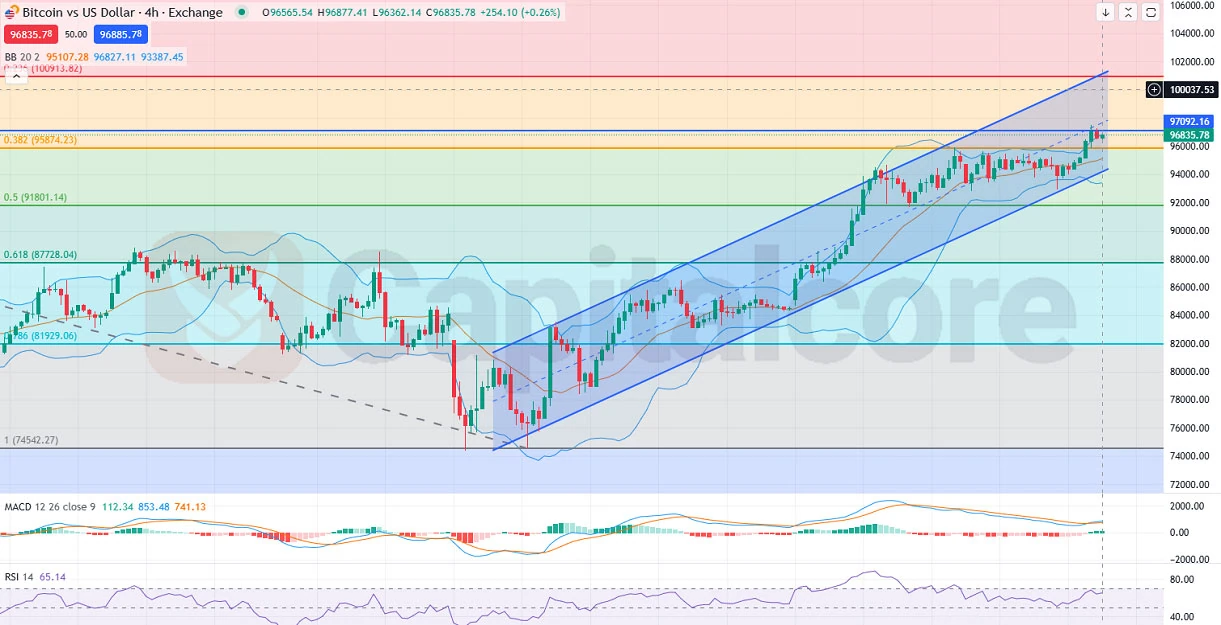
Chart Notes:
• Chart time-zone is UTC (+03:00)
• Candles’ time-frame is 4h.
On the H4 chart, BTCUSD appears to be riding a strong bullish trend, currently trading in the upper half of the Bollinger Bands near the upper band. Even though the bands were initially tight, they have slightly expanded, yet remain relatively narrow compared to previous periods. The upper Bollinger Band aligns with a key resistance level just above the 0.382 Fibonacci retracement, and price action has repeatedly tested and reacted to this zone without a decisive break so far. Nonetheless, buyers are still attempting to push BTC-USD higher, targeting new resistance levels if a breakout occurs. The MACD, RSI, and MACD histogram all lean toward continued bullish pressure, suggesting that if the price can overcome the upper Bollinger Band and this fib-based resistance, BTC/USD daily chart technical and fundamental analysis favors potential upside continuation in the near term.
• DISCLAIMER: Please note that the above analysis is not an investment suggestion by “Capitalcore LLC”. This post has been published only for educational purposes.
