Wall Street 30 Supported by Strong Economic Data
US30, commonly known as Dow Jones or DJIA, is a significant index representing the top 30 industrial companies listed in the United States, acting as a crucial indicator of overall market health. Traders often refer to this index as “Wall Street 30”. Today’s fundamental analysis for US30 highlights critical economic events including Residential Building Permits, Housing Starts, Import Price Index, and Consumer Sentiment data from the University of Michigan, along with an important speech by Richmond Fed President Thomas Barkin. Stronger-than-expected building permits and housing starts can indicate robust economic growth and higher investor confidence, potentially driving bullish momentum in the US30. Simultaneously, improvements in import price data and higher consumer sentiment readings could reinforce expectations of sustained economic growth, further supporting an upward trend. Market participants will also closely monitor President Barkin’s comments for clues about future monetary policy direction, which could introduce volatility into the market depending on the tone adopted.
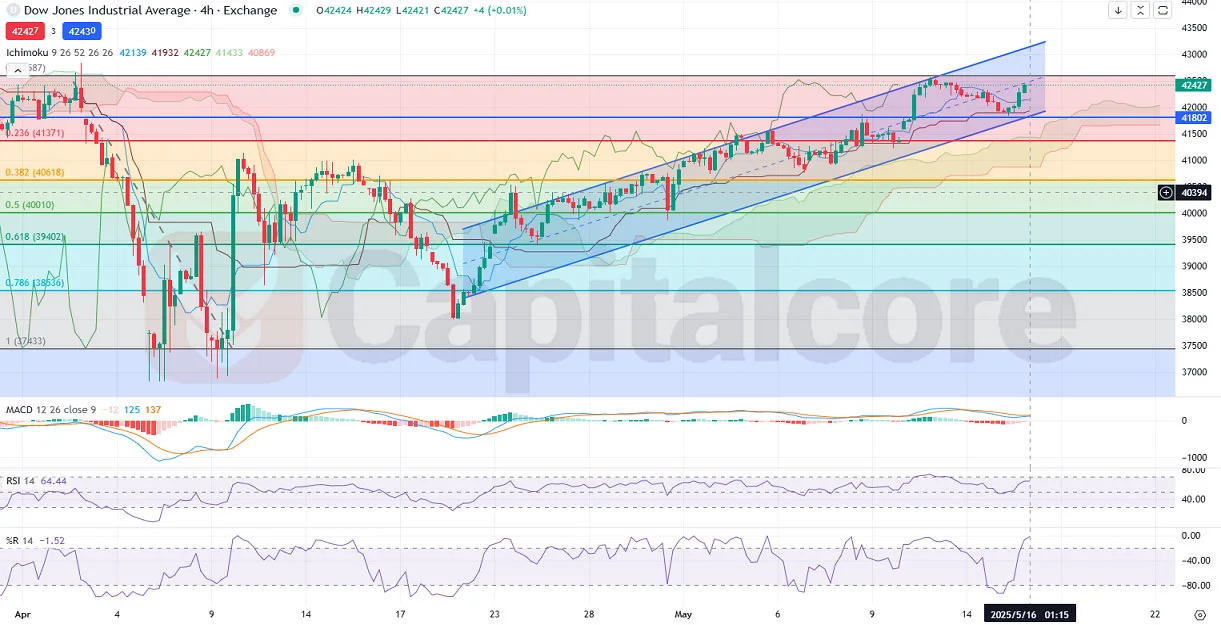
Chart Notes:
• Chart time-zone is UTC (+03:00)
• Candles’ time-frame is 4h.
Analyzing the US30 Dow Jones H4 chart, the price is clearly in a bullish trend, moving between the 0.236 Fibonacci retracement level towards the critical 0 level, indicating a strong buying momentum. Price action is currently positioned above the Ichimoku green cloud, though the cloud has slightly narrowed, suggesting a minor reduction in bullish strength; however, the lower cloud boundary has flattened horizontally, offering solid support. The MACD indicator and its histogram are exhibiting bullish signals, with the MACD line remaining above the signal line and positive histogram bars gaining strength. Concurrently, the RSI indicator at 64.64 suggests room for continued upward movement before reaching an overbought zone. The Williams %R indicator positioned near -1.52 also confirms bullish sentiment, reflecting strong buying pressure.
• DISCLAIMER: Please note that the above analysis is not an investment suggestion by “Capitalcore LLC”. This post has been published only for educational purposes.
