EUR-USD Daily Chart: Key Levels and Indicators Analysis
EUR USD, known in forex trading as the “Fiber,” represents the exchange rate between the Euro and the US Dollar and is one of the most traded currency pairs globally. The Fiber often reflects market sentiment towards the European and U.S. economies. Today’s upcoming news includes crucial data releases: U.S. Building Permits, Housing Starts, Import Price Index, Capacity Utilization Rate, and Industrial Production. Positive outcomes in these metrics, particularly Building Permits and Industrial Production, could strengthen the USD, potentially causing downward pressure on EURUSD. On the other side, Eurozone releases including Trade Balance and ZEW Economic Sentiment may impact the Euro positively if outcomes exceed forecasts, promoting upward momentum in EUR-USD. Traders should monitor these indicators closely for price action signals.
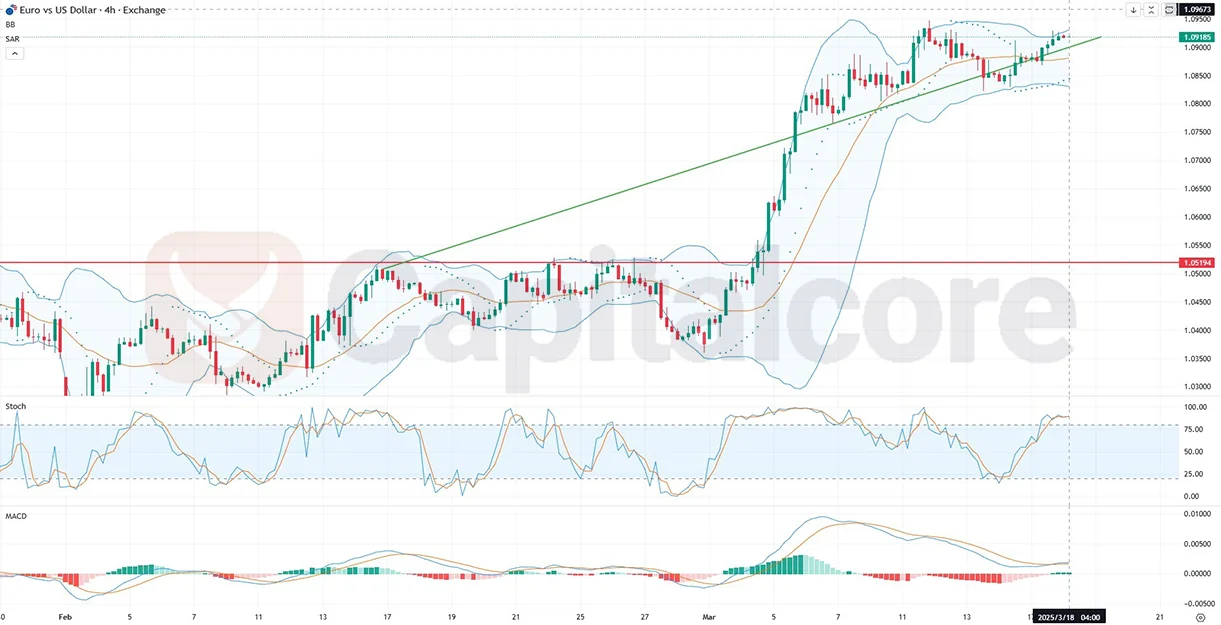 Chart Notes:
• Chart time-zone is UTC (+02:00)
• Candles’ time-frame is 4h.
Analyzing the provided EUR/USD H4 chart reveals that the price has decisively broken through a significant resistance line, indicating strong bullish momentum. However, the price currently faces resistance at the horizontal line and the upper Bollinger Band, suggesting a potential short-term correction or pullback. Technical indicators like the Bollinger Bands hint at possible corrective moves downwards towards the supporting ascending trendline and subsequently to the middle Bollinger Band, providing dynamic support around this zone. Should selling pressure persist, a deeper retracement to the lower Bollinger Band and key support at 1.05194 may occur. Additionally, the Stochastic indicator is entering an overbought territory, signaling a potential bearish reversal or consolidation soon. Concurrently, the MACD histogram shows decreasing bullish momentum, corroborating the possibility of an imminent correction. Traders are advised to observe price action near these technical levels for confirmation.
• DISCLAIMER: Please note that the above analysis is not an investment suggestion by “Capitalcore LLC”. This post has been published only for educational purposes.
