UK100 Index Near Crucial Resistance Levels
The UK100_FTSE100, often called the “Footsie,” represents the top 100 companies listed on the London Stock Exchange and serves as a significant indicator of the UK’s economic health and market sentiment. Today’s fundamental analysis highlights the impact of upcoming economic data from the US, including GDP figures, unemployment claims, and energy inventory reports from API and EIA, as these can directly influence global investor sentiment and subsequently affect the FTSE100. In the UK, key speeches from BOE Governor Andrew Bailey and Deputy Governor Sarah Breeden will be critical, with their potentially hawkish tones expected to influence GBP strength and investor sentiment towards UK equities.
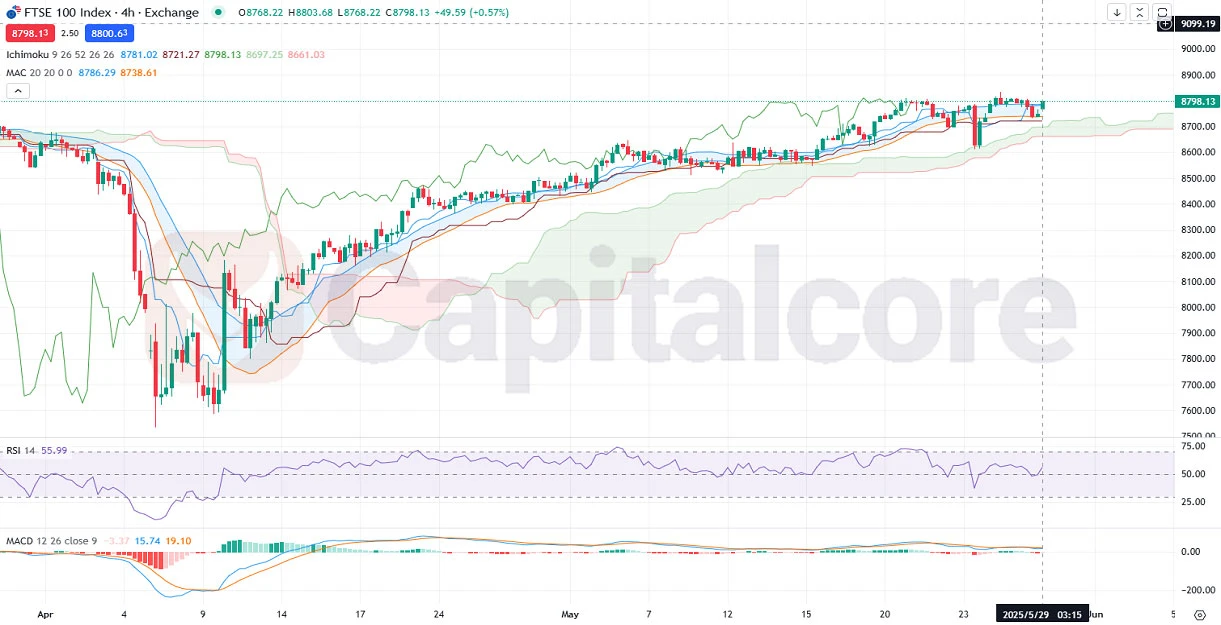
Chart Notes:
• Chart time-zone is UTC (+03:00)
• Candles’ time-frame is 4h.
Examining the provided UK100 H4 chart, the index has maintained a bullish price action since April, clearly passing through the Ichimoku cloud mid-April and remaining steadily above the green cloud. Although the Ichimoku cloud has recently become thinner, with its upper and lower bands flattening horizontally, the overall trend continues to indicate bullishness. The Moving Average Channel (MAC) suggests resistance at its upper blue line, as recent candles have touched this upper boundary, possibly signaling a short-term consolidation or pullback. Indicators such as the RSI and MACD support this bullish momentum but also indicate moderation in strength, suggesting cautious optimism in price movement.
• DISCLAIMER: Please note that the above analysis is not an investment suggestion by “Capitalcore LLC”. This post has been published only for educational purposes.
