Nasdaq 100 Bearish Trend Analysis
The Nasdaq 100 Index, often known by its nickname ND100, represents the top 100 non-financial companies traded on the NASDAQ exchange and is traded against the USD in forex markets. Fundamentally, today, traders’ attention is focused on significant upcoming USD news involving the Federal Reserve Governor Adriana Kugler’s speech on inflation dynamics and consumer credit figures. Hawkish comments from Governor Kugler, reflecting tighter monetary policy or indicating further rate hikes, would likely strengthen the USD, potentially exerting downward pressure on ND100. Conversely, a positive report on consumer credit could signal robust consumer spending, providing mild support for equities and potentially cushioning ND100’s fall.
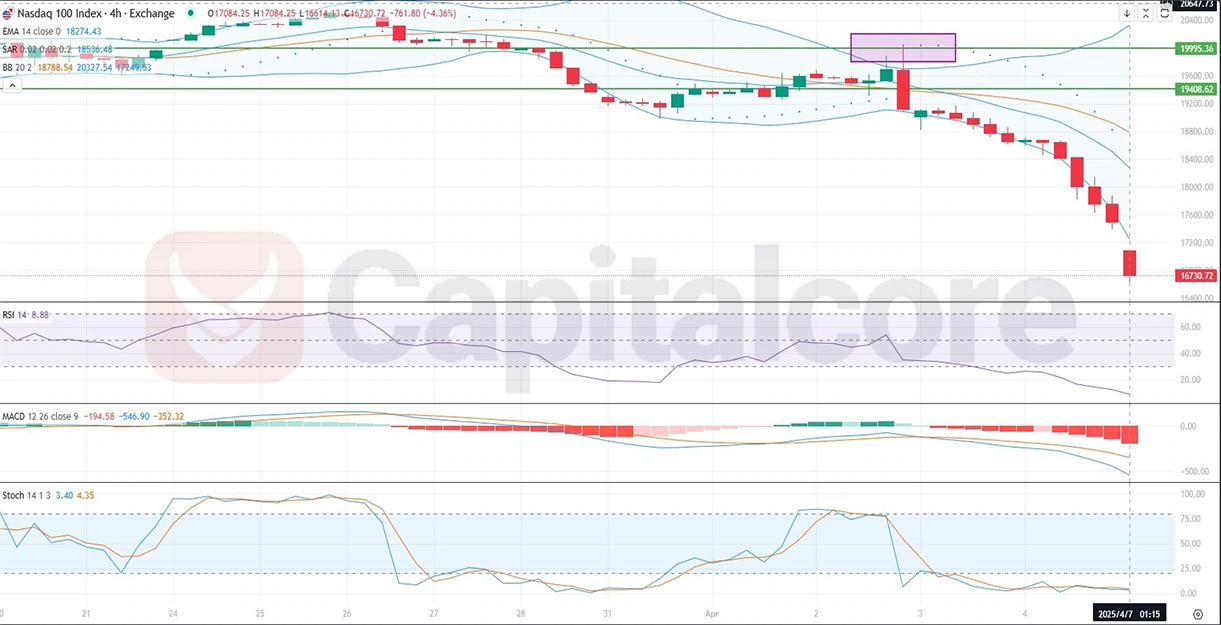
Chart Notes:
• Chart time-zone is UTC (+03:00)
• Candles’ time-frame is 4h.
From the technical perspective of the ND100 H4 chart, the price action clearly indicates bearish momentum. The price strongly broke its previous H4 support line, retested it briefly, and continued aggressively downward, effortlessly penetrating daily support. This sharp bearish movement is supported by multiple large-bodied red candles and a notable price gap between recent candles, underscoring traders’ urgency to sell. Bollinger Bands are widening, suggesting heightened volatility and continuation of the bearish trend. The RSI, currently at an oversold extreme of 8.88, indicates strong bearish momentum but also hints at a potential short-term bounce due to overselling. MACD remains bearish, showing expanding negative histograms, confirming downward pressure. Stochastic indicators are deeply oversold, reinforcing the downward trend’s strength but again cautioning of potential minor retracements. EMA 14 further emphasizes bearish sentiment as prices remain significantly below the moving average line.
• DISCLAIMER: Please note that the above analysis is not an investment suggestion by “Capitalcore LLC”. This post has been published only for educational purposes.
