Nasdaq 100 analysis ahead of USD jobless data
The Nasdaq 100, also known as ND100 or the US Tech Index, represents the top 100 non-financial companies listed on the Nasdaq exchange, making it a popular instrument in Forex and CFD trading. Renowned for its volatility and tech-driven composition, it often reacts strongly to U.S. economic data and Federal Reserve announcements. Today, traders are closely watching the Nasdaq 100 as several impactful U.S. fundamentals are due for release. The spotlight is on Initial Jobless Claims, where a lower-than-expected figure would support the USD and possibly pressure ND100. Additionally, three FOMC speakers—Musalem, Waller, and Daly—are scheduled to discuss the economic outlook, and any hawkish tone could hint at tighter monetary policy, reinforcing the dollar and possibly leading to a short-term dip in equities. Secondary data, including Natural Gas Storage and the 30-Year Bond Auction, may influence risk sentiment, but labor data and Fed commentary are expected to drive the main price action in ND100 trading today.
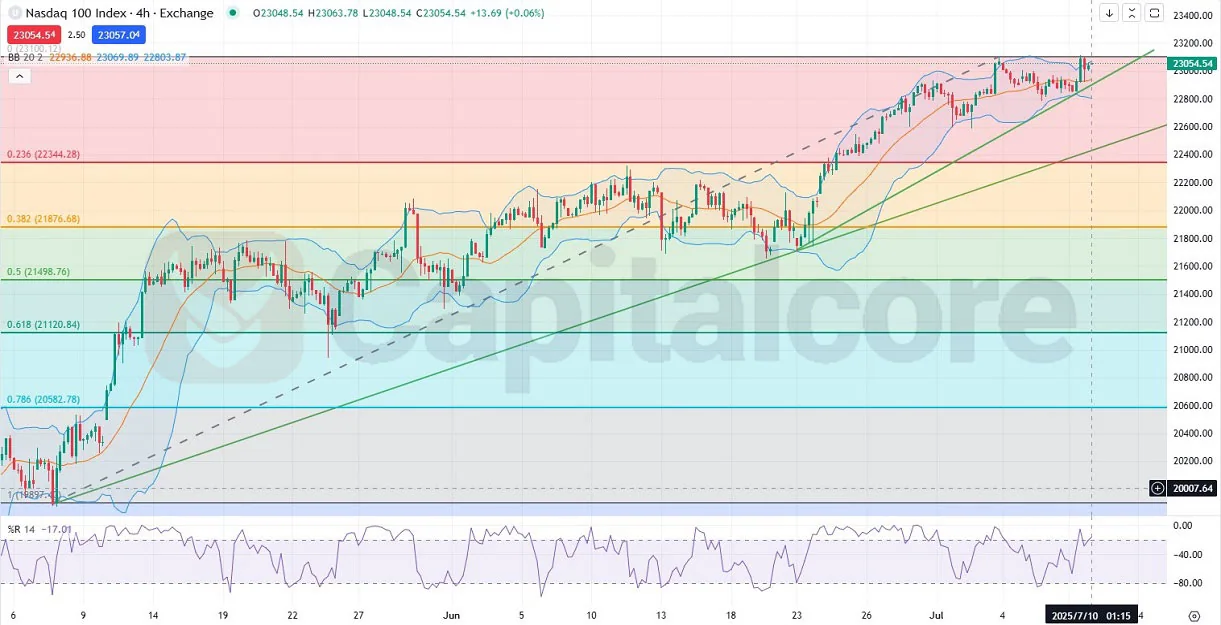
Chart Notes:
• Chart time-zone is UTC (+03:00)
• Candles’ time-frame is 4h.
Technically, the ND100 is maintaining a strong bullish trend on both short- and long-term timeframes, currently hovering near its all-time high (ATH). As shown on the H4 chart, price action is steadily climbing along the ascending trendline, with candles moving in the upper half of the Bollinger Bands, frequently touching the upper band, indicating sustained buying pressure. Immediate support lies around 23,000 and 22,800, with 0.236 Fibonacci retracement level (22,344). The Williams %R indicator is at -17.01, entering overbought territory, which may signal a potential short-term consolidation or pullback, especially if today’s fundamentals trigger a shift in sentiment. However, overall market structure remains bullish, and if the price breaks above the current resistance zone, it could pave the way for a new all-time high, reinforcing the Nasdaq 100 ND100 bullish trend.
•DISCLAIMER: Please note that the above analysis is not an investment suggestion by “Capitalcore LLC”. This post has been published only for educational purposes.
