Market News
Sideways Trend Dominates USDJPY H4 Technical Analysis
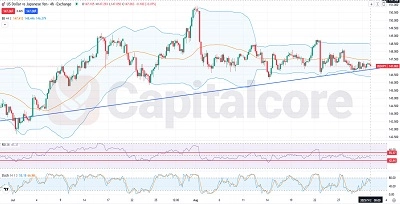
Bollinger Bands Narrow on USDJPY H4 Chart The USD/JPY forex pair, often referred to as the “Gopher,” represents the US
Bollinger Bands Narrow on USDJPY H4 Chart The USD/JPY forex pair, often referred to as the “Gopher,” represents the US
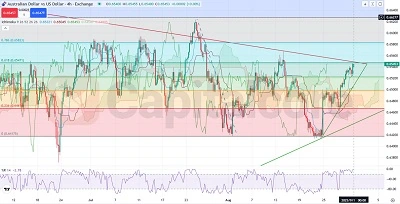
AUDUSD bullish momentum with Ichimoku confirmation The AUD/USD, also known by traders as the “Aussie”, is one of the most
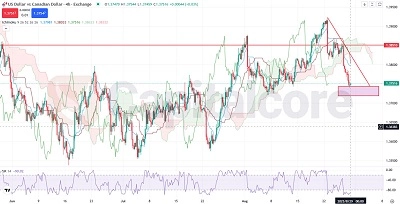
Loonie Chart Bullish Reversal Signal Based on the upcoming economic events, the USDCAD pair, nicknamed the “Loonie” due to the
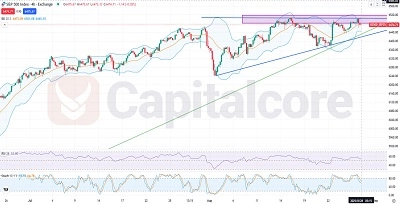
US500 Index Forms Bullish Triangle Pattern The US500, commonly known as the S&P 500 index, is a prominent stock market
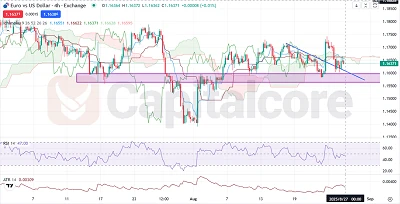
U.S. Energy Data in Focus for Dollar Moves EUR/USD, the most actively traded currency pair in the world, reflects the
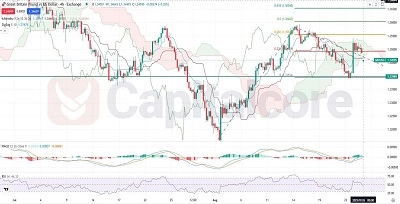
GBP USD Hovering at Key Fibonacci Levels GBP/USD, commonly referred to as “Cable,” is one of the most widely traded
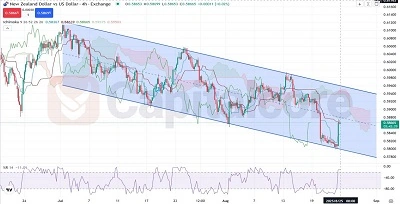
NZDUSD Price Movement and Indicators analysis The NZD/USD forex pair, often nicknamed the “Kiwi”, represents the exchange rate between the
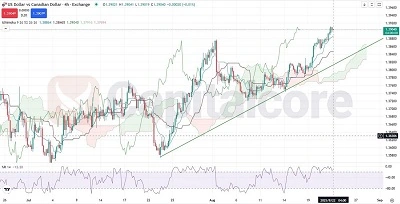
Loonie Ichimoku cloud bullish confirmation The USD/CAD forex pair, known as the “Loonie,” reflects the exchange rate between the U.S.
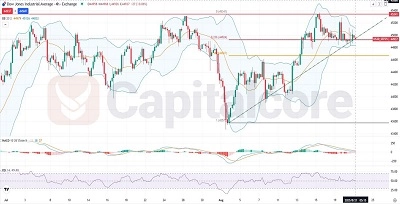
Dow Jones Index Bullish Trendline Holds Firm The Dow Jones Industrial Average, widely recognized as the “US30” and affectionately nicknamed