Market News
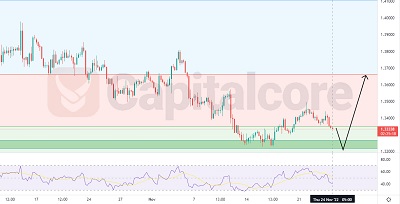
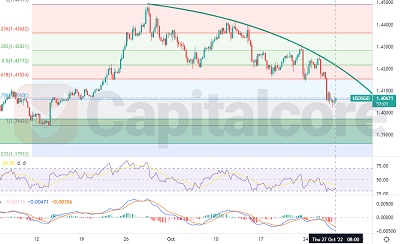
USD/CAD, getting ready for another ascending leg
The bullish Power seems to be decreasing After a significant ascending wave, the price line on USD/CAD price chart went
The bullish Power seems to be decreasing After a significant ascending wave, the price line on USD/CAD price chart went
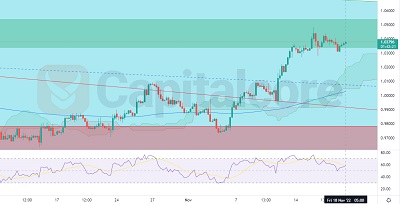
The support level looks too fragile to hold the price The price line on EURUSD price chart started an ascending
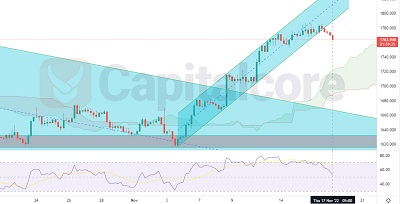
The bullish trend has ended The price line on Gold price chart, started a bullish trend, after breaking above the
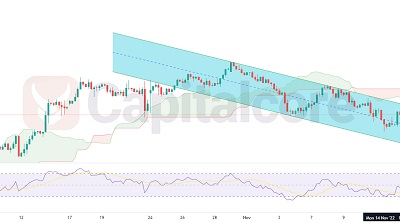
GBP/JPY at the top of the channel GBP/JPY started a bearish trend on late October 2022; the formation of a
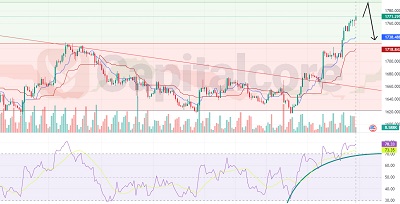
A descending wave could be expected The price line on Gold price chart, went through a sharp ascending wave by
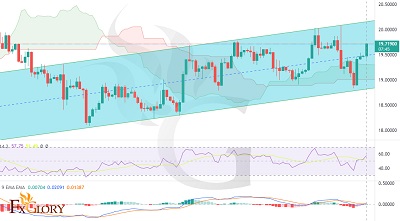
The support level looks too fragile to hold the price The price line on Silver price chart started a bullish
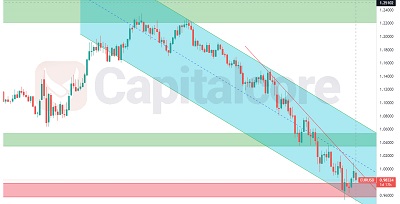
A bullish leg can be expected The price line on EUR/USD price chart has been moving within a bearish channel
USD/SGD is being oversold The price line on USD/SGD price chart started a descending wave on 28th of September 2022.
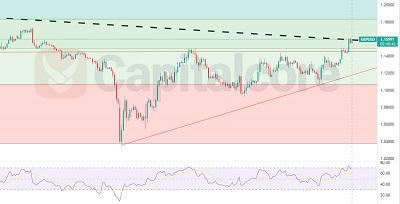
An ascending wave can be expected The price line on GBPUSD price chart, had been moving within an ascending triangle;