Forex SILVERUSD Analysis After Breaking Trendline
The SILVERUSD pair, commonly known as “Silver Spot” or “XAGUSD,” reflects the value of silver measured against the US Dollar, crucial for traders interested in precious metals and forex markets. Today, fundamental factors influencing SILVERUSD include significant speeches by FOMC members, such as Federal Reserve Governor Adriana Kugler and New York Fed President John Williams, whose remarks about interest rates and the economic outlook can cause volatility. Housing market data releases, including the S&P Case-Shiller and FHFA Home Price Indices, as well as New Home Sales and the Richmond Manufacturing Index, will further influence the USD and indirectly affect SILVERUSD by altering investor sentiment and economic forecasts.
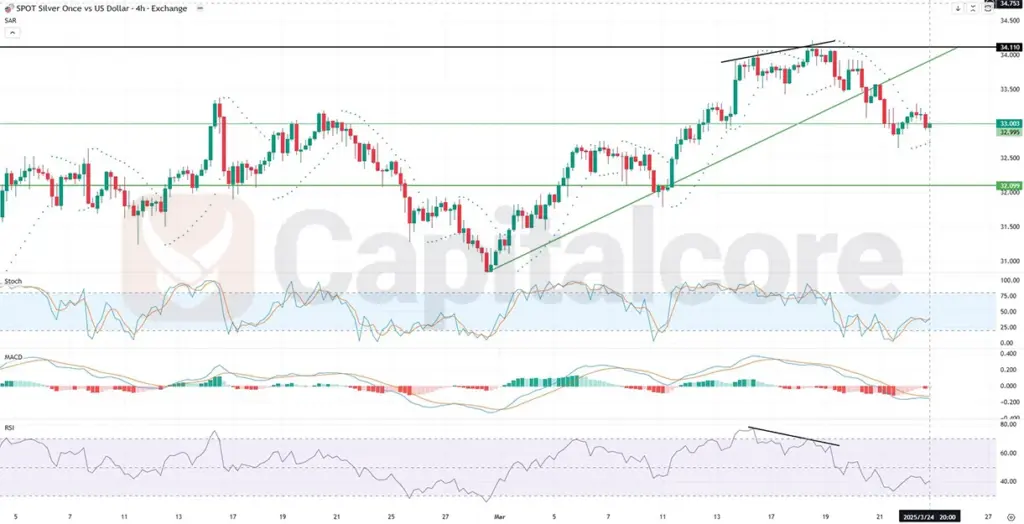
Chart Notes:
• Chart time-zone is UTC (+02:00)
• Candles’ time-frame is 4h.
Technical analysis of the SILVERUSD H4 chart reveals that price action has broken below its upward trendline, reaching a critical support zone. If this support level holds firmly, it could lead the price back upwards toward a potential target at 34.110. Conversely, failing to sustain above this support may drive SILVERUSD further downward, testing the next support level at 32.099. The RSI indicator displays a bearish divergence, suggesting weakening upward momentum, while the stochastic oscillator is approaching an oversold area, signaling a potential rebound. The MACD indicator illustrates bearish momentum that appears to be slowing, possibly indicating a forthcoming reversal. Moreover, the last five Parabolic SAR points are below the price, signaling short-term bullish support.
• DISCLAIMER: Please note that the above analysis is not an investment suggestion by “Capitalcore LLC”. This post has been published only for educational purposes.
