US500 Approaches Critical Resistance Level in Bullish Trend
The US500, also known as the S&P 500, is a widely-followed index reflecting the performance of 500 major U.S. companies and serves as a benchmark for the overall health of the U.S. stock market. Today’s fundamental analysis highlights significant upcoming events, including speeches from key Federal Reserve officials, particularly Chair Jerome Powell and San Francisco Fed President Mary Daly, whose comments often provide critical insights into future monetary policy direction. Important economic releases today, such as Retail Sales, Producer Price Index (PPI), and unemployment claims data, are closely monitored as they offer crucial signals regarding consumer spending trends, inflationary pressures, and overall economic health, potentially affecting volatility in the US500.
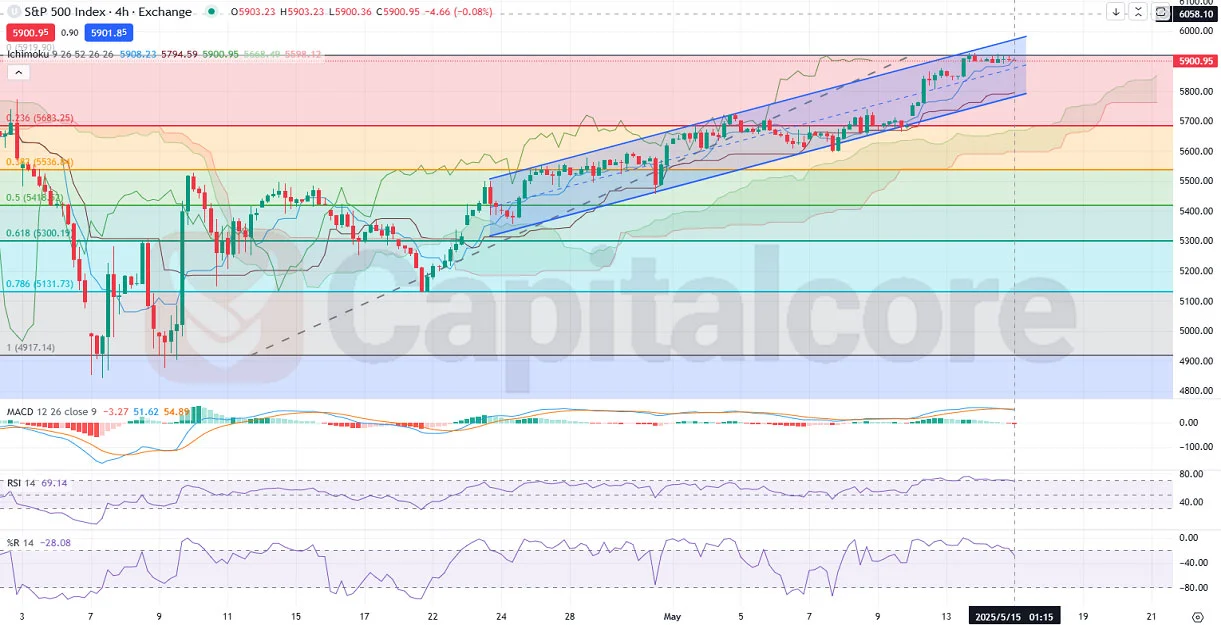
Chart Notes:
• Chart time-zone is UTC (+03:00)
• Candles’ time-frame is 4h.
Technically, examining the 4-hour chart for the US500, we see a bullish price action sustained above the Ichimoku cloud, indicating strong upward momentum. The lower band of the Ichimoku green cloud is moving horizontally, aligning with the current resistance at the 0 Fibonacci retracement level. Recent candlestick formations have alternated between bullish and bearish, suggesting indecision at this resistance level as the price has yet to decisively break through the Fibonacci resistance. Additionally, technical indicators including MACD and its histogram exhibit decreasing bullish momentum, hinting at potential exhaustion. The RSI, hovering near overbought levels, and %R also suggest caution for traders, as the market might face a potential retracement or consolidation if bullish momentum weakens further.
• DISCLAIMER: Please note that the above analysis is not an investment suggestion by “Capitalcore LLC”. This post has been published only for educational purposes.
