Footsie Forecast Using H4 Indicators
The UK100, often called the FTSE 100 or simply “Footsie,” represents the 100 most capitalized companies listed on the London Stock Exchange and serves as a key indicator of the UK’s economic health, directly influencing the British Pound (GBP). Fundamental analysis today highlights significant events: public sector borrowing data from the Office for National Statistics and several high-profile speeches by BOE officials, including Deputy Governor Sarah Breeden and Chief Economist Huw Pill. Hawkish statements indicating possible monetary tightening and positive PMI data from manufacturing and services sectors would strengthen GBP, potentially boosting UK100. Conversely, a larger-than-expected budget deficit could create bearish pressure, raising caution among traders.
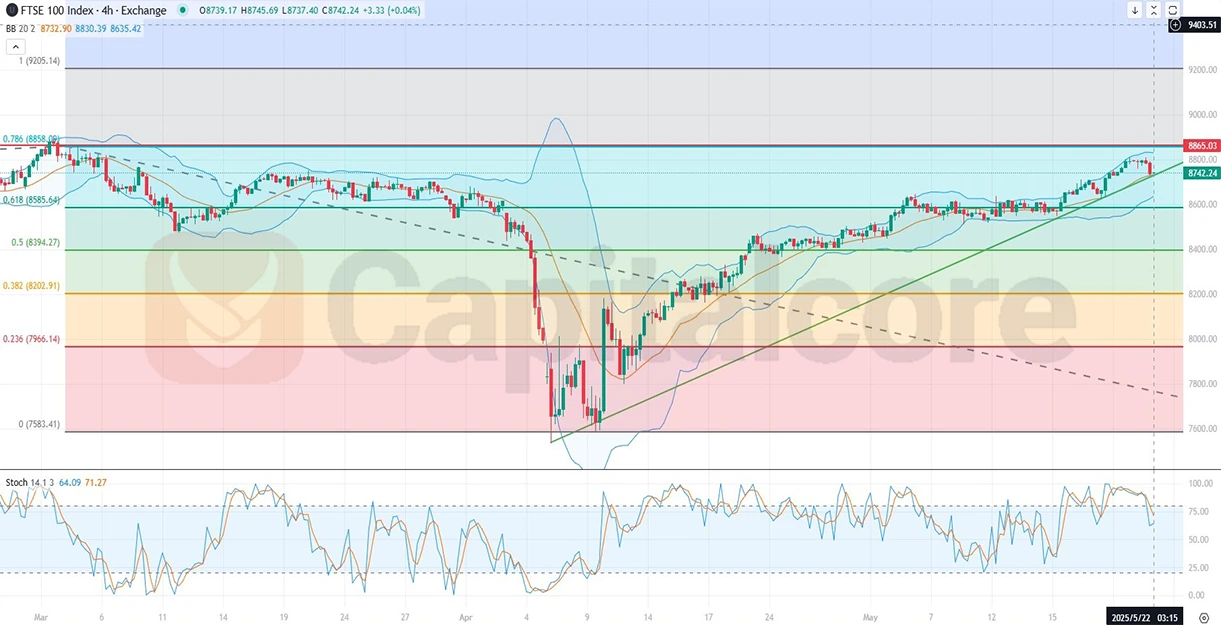
Chart Notes:
• Chart time-zone is UTC (+03:00)
• Candles’ time-frame is 4h.
Analyzing the provided UK100 H4 chart, price action indicates a steady bullish momentum, moving towards a crucial resistance near the previous high around 8865, which coincides with the critical 0.786 Fibonacci expansion level. A successful breakout could propel prices towards the next significant Fibonacci expansion at level 1, marking a stronger bullish run. Bollinger Bands currently display widening volatility, suggesting potential price acceleration. However, stochastic indicators are approaching the overbought area, hinting at a potential short-term pullback before resuming upward momentum, thus emphasizing caution and vigilance among traders.
• DISCLAIMER: Please note that the above analysis is not an investment suggestion by “Capitalcore LLC”. This post has been published only for educational purposes.
