Descending Triangle Forms on H4 Chart
The USD-CAD currency pair, commonly referred to as the “Loonie,” reflects the exchange rate between the US dollar and the Canadian dollar and is closely tied to movements in crude oil prices and monetary policy expectations from both the Federal Reserve and the Bank of Canada (BoC). Today’s trading session features several key events that may influence USD/CAD volatility. Canada’s New Housing Price Index (NHPI) came in slightly above expectations at 0.1% m/m versus 0.0% forecast, suggesting mild underlying strength in the Canadian housing market, though likely not impactful enough to shift BoC policy expectations. On the US side, crude oil inventory data is due, with a forecasted draw of 0.9 million barrels, which could support oil prices and, by extension, the Canadian dollar if realized. Additionally, speeches from FOMC members Thomas Barkin and Michelle Bowman later today could shape USD sentiment depending on their tone regarding inflation and future rate paths. As such, USD/CAD traders should stay alert to shifts in oil market dynamics and hawkish or dovish cues from the Fed speakers, as these factors will likely set the tone for near-term price action.
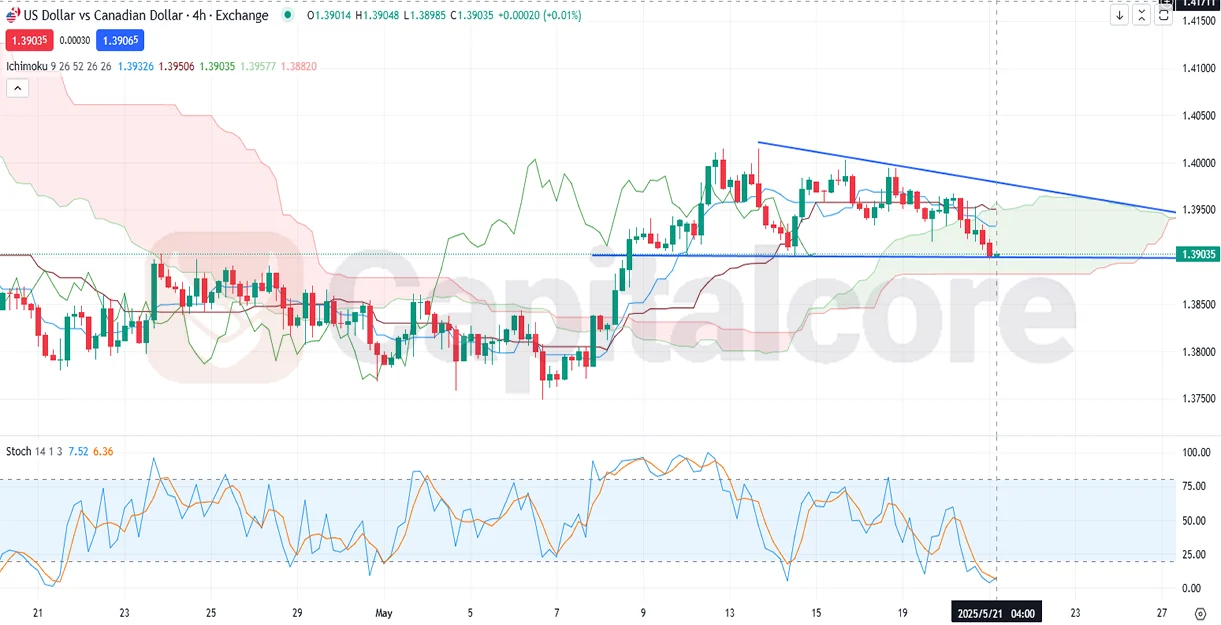
Chart Notes:
• Chart time-zone is UTC (+03:00)
• Candles’ time-frame is 4h.
Analyzing the USD/CAD H4 chart, the pair is currently trading within a descending triangle pattern, with price action consistently making lower highs while holding above the horizontal support near the 1.3900 level. This structure suggests potential bearish continuation if the key support is broken. The Ichimoku Cloud indicates weakening bullish momentum, with price trading below the Tenkan-sen and Kijun-sen lines and dipping into the cloud, signaling uncertainty and possible bearish pressure. The Senkou Span A is flattening, and a bearish Kumo twist could emerge if downward momentum continues. Additionally, the Stochastic Oscillator is deeply oversold but beginning to flatten, hinting at potential short-term consolidation or a minor corrective bounce. Traders should closely monitor the 1.3900 support zone — a decisive break below could confirm bearish continuation, while a rebound may keep the pair within the current triangle consolidation.
• DISCLAIMER: Please note that the above analysis is not an investment suggestion by “Capitalcore LLC”. This post has been published only for educational purposes.
