USDCAD Forecast with NFP and CAD Jobs Data
The USD/CAD, often referred to by traders as the “Loonie”, is a major forex pair that represents the exchange rate between the US Dollar and the Canadian Dollar. It is heavily influenced by oil prices, economic data from both the US and Canada, and monetary policy expectations.
Fundamentally, today’s focus for the USDCAD forex pair is on key employment data from both countries. Canada is releasing its Employment Change and Unemployment Rate, crucial indicators of labor market health and consumer spending strength. Better-than-expected Canadian job data typically strengthens the CAD, putting pressure on USD CAD. On the US side, markets are closely watching the Non-Farm Payrolls (NFP) and Unemployment Rate, which are among the most impactful economic indicators for the USD. Additionally, several speeches from Federal Reserve officials, including Fed Chair Jerome Powell, could introduce volatility depending on the tone—hawkish commentary may strengthen the USD, while dovish remarks could weaken it. With both countries releasing critical labor data today, heightened volatility and strong directional moves are likely for the USD-CAD pair.
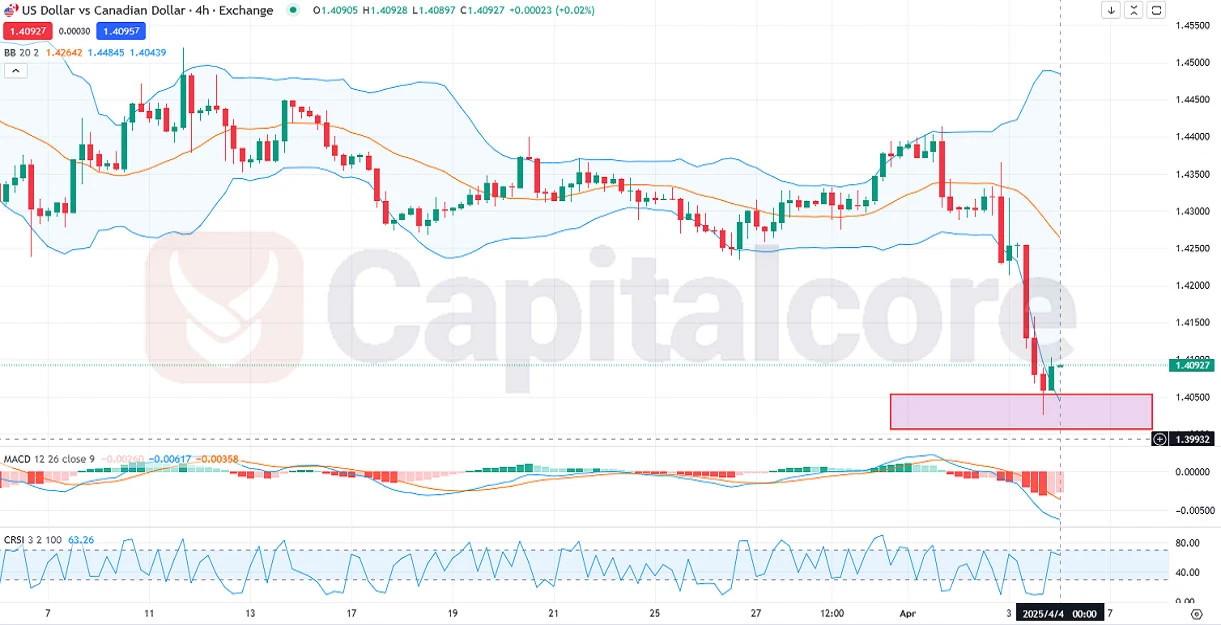
Chart Notes:
• Chart time-zone is UTC (+03:00)
• Candles’ time-frame is 4h.
Technically, as seen in the attached USDCAD H4 chart, the price has been in a clear bearish trend, with 9 out of the last 15 candles being red, confirming downward momentum. However, recent bullish candles show signs of a potential correction or reversal after the pair reached a key support zone highlighted in red. The price touched this support near 1.3993 and is now attempting a bounce. It’s still in the lower half of the Bollinger Bands, indicating bearish pressure, but the latest candle shows a push toward the middle band, which may act as a near-term resistance. On the MACD, both the main line and the histogram are still in negative territory, but the histogram bars are fading in color (light red), which suggests decreasing bearish momentum. The Connor RSI (CRSI) is also pointing higher and currently sits above 60, signaling that short-term bullish pressure is building. If today’s fundamental releases support the CAD, this bounce might be short-lived; otherwise, a breakout above the middle Bollinger Band could confirm a stronger corrective move.
• DISCLAIMER: Please note that the above analysis is not an investment suggestion by “Capitalcore LLC”. This post has been published only for educational purposes.
