Dow Jones Daily Chart Technical Analysis RSI MACD
US30, also known as the Dow Jones Industrial Average, is a popular stock market index representing 30 significant publicly traded companies in the U.S. Often called “Dow,” it serves as a crucial indicator of the overall health of the U.S. economy. Today’s key economic events include the Core Producer Price Index (PPI), Producer Price Index, Initial Jobless Claims, Natural Gas Storage levels, and the 30-Year Treasury Bond auction results. An increase in PPI figures above forecasts typically supports the USD and can apply bearish pressure to US30 due to prospects of tighter monetary policy. Conversely, lower-than-expected Initial Jobless Claims would reflect economic strength, potentially offsetting bearish sentiments and providing support for the Dow.
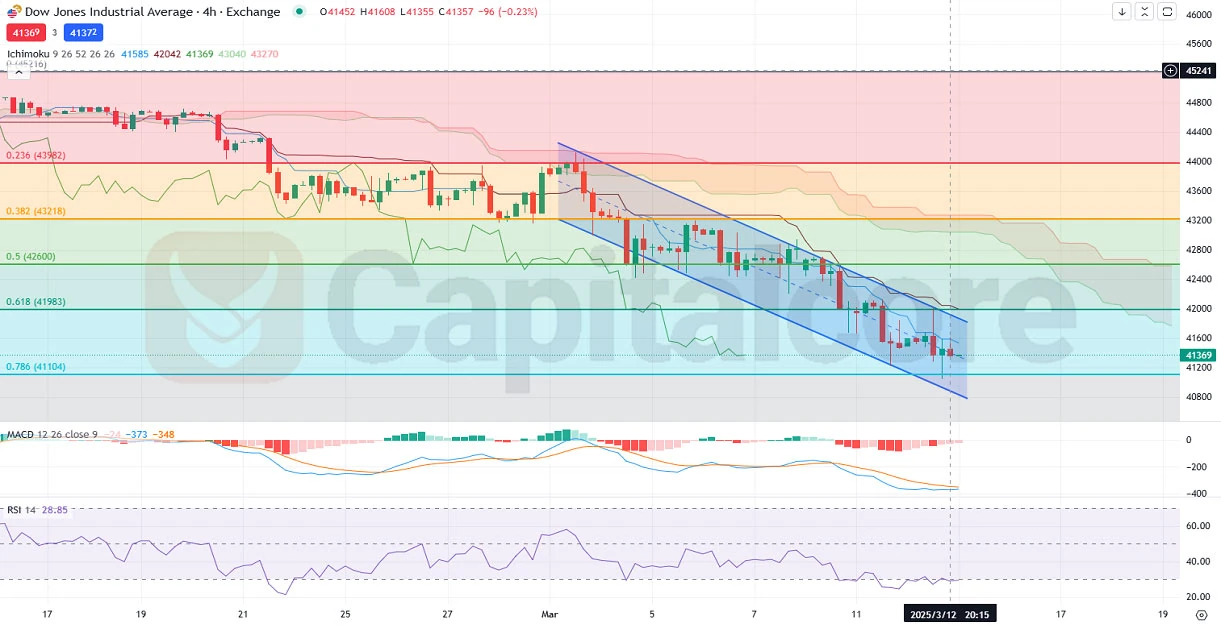
Chart Notes:
• Chart time-zone is UTC (+02:00)
• Candles’ time-frame is 4h.
Analyzing the US30 H4 chart, the price is moving within a clear bearish channel below the Ichimoku cloud, reflecting sustained downward momentum. Price action is consolidating between the Fibonacci retracement levels of 0.618 (41,983) and 0.786 (41,104), indicating strong bearish pressure. MACD continues to exhibit negative momentum with bearish histogram bars, while RSI remains below 30, confirming oversold conditions and highlighting the risk of a corrective rebound or temporary consolidation.
• DISCLAIMER: Please note that the above analysis is not an investment suggestion by “Capitalcore LLC”. This post has been published only for educational purposes.
