EURUSD Price Outlook: Bullish or Bearish Break Ahead?
The EUR/USD forex pair, often nicknamed “Fiber,” is one of the most heavily traded currency pairs globally, representing the exchange rate between the Euro and the US Dollar. Known for its liquidity and volatility, this pair’s forecast reflects economic and monetary policy dynamics in the Eurozone and the United States.
For today’s EURUSD fundamental overview, the market’s attention is focused on U.S. inflation data, including the Core Consumer Price Index (CPI) and CPI metrics, which are pivotal indicators of economic health and influence the Federal Reserve’s monetary policy. Additionally, speeches by prominent Federal Reserve officials, including Richmond and Minneapolis Fed Presidents, could provide further clues regarding the Fed’s interest rate strategy. On the Eurozone side, wholesale price index figures and manufacturing production updates are expected to have a relatively moderate impact, with the focus remaining on the broader inflationary trends. As traders assess these data points, the EURUSD prices may see heightened volatility, especially if the inflation data outperforms or underperforms forecasts.
Chart Notes:
• Chart time-zone is UTC (+02:00)
• Candles’ time-frame is 4h.
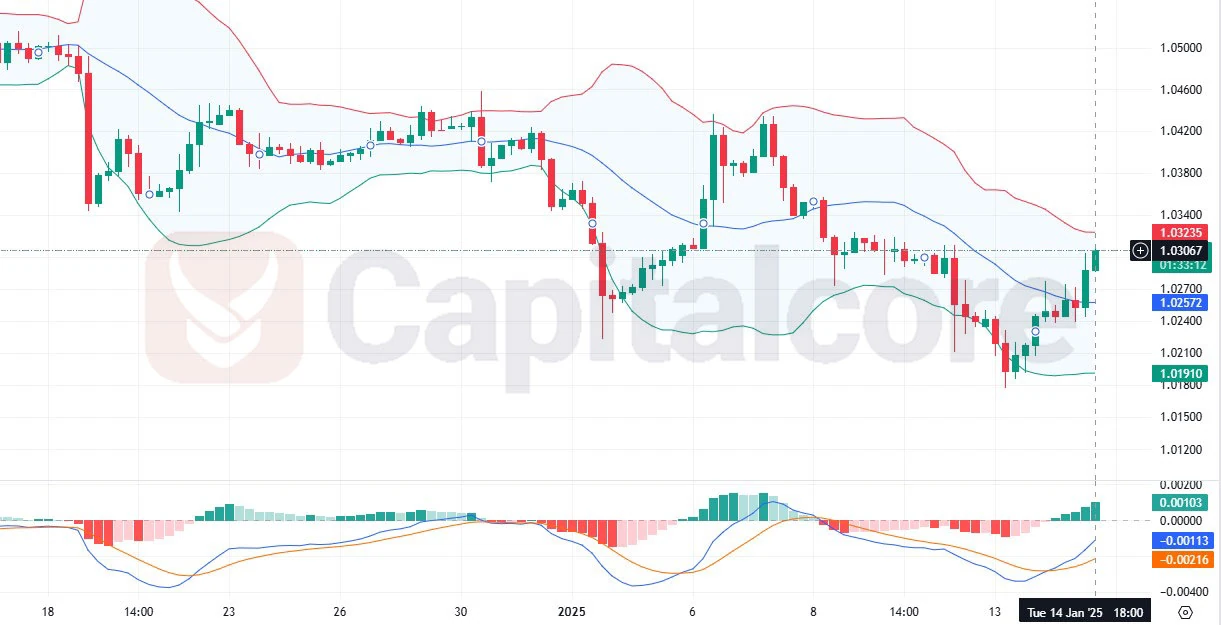
The H4 chart of EURUSD indicates an ongoing recovery from recent lows, with the pair’s price action attempting to breach the upper Bollinger Band. The Bollinger Bands show widening, which often signals increasing volatility. The Fiber is trading near the middle and upper bands, suggesting its bullish trend may continue if resistance levels are broken.
The MACD (Moving Average Convergence Divergence) indicator shows bullish divergence, with the MACD line crossing above the signal line and histogram bars turning positive. This setup further confirms the likelihood of upward momentum. However, a rejection from the current resistance zone could trigger a reversal to test the middle or lower Bollinger Band. Overall, traders should monitor key resistance at 1.0320 and support near 1.0190 for directional cues.
•DISCLAIMER: Please note that the above analysis is not an investment suggestion by “Capitalcore LLC”. This post has been published only for educational purposes.


